
Mixpanel: What you (probably) didn’t know

Every now and then you have a conversation that opens your eyes to an idea staring you in the face, waiting for you to notice it. A few weeks ago, I was walking a partner through our product vision and recent shipments, when he exclaimed, “wow, I didn’t know Mixpanel could do that.” Then he said it twice more during our 20-minute talk.
He had been using Mixpanel for years, but has a lot going on (as we all do), and some features he values had slipped past him. In case you’re in the same situation, our Product Management and Customer Success teams have surfaced their greatest hits of “I didn’t realize that” moments from throughout the past year.
The topics span activation metrics, chatbots, drag-and-drop dashboards, and floppy disks.
1. Build highly-customized dashboards, and impress teammates at your next meeting
Anyone who makes decisions with data should have a go-to dashboard. They’re how I check on which blog articles the world finds interesting. To that end, an additional inspiration for this post was the popularity of last year’s article, 2019 Product Highlights.
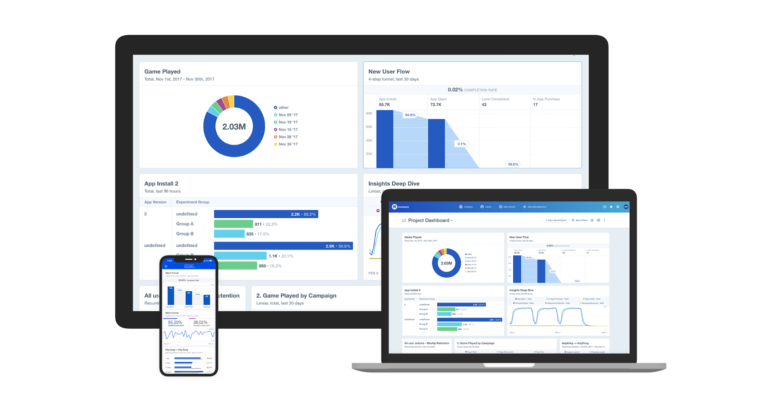
In the last year, we’ve released dozens of dashboard upgrades. Highlights include:
- Drag-and-drop cards that can be resized to your liking, so your dashboard is ready for any metrics meeting
- New visualization options, including pie charts, all in new colors that make it easy to distinguish trends and segments
- Filter by cohorts and properties to see your metrics from any lens, all in one place
- Customizable dashboard descriptions that let you easily explain the metrics you’re tracking, or highlight a takeaway for your team
- Email digests so you can get weekly updates on any dashboard in your inbox—and even send them directly to teammates without Mixpanel accounts
2. Query Mixpanel data with SQL, enabled by managed pipelines to your data warehouse
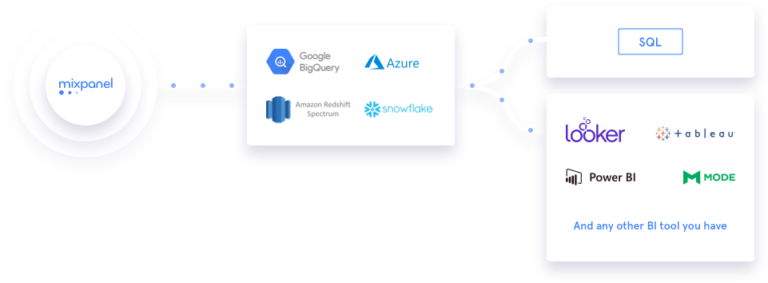
A common request many analysts and data scientists have is, “how can I query Mixpanel data with SQL?” It’s simply what they feel most comfortable with, and when user data is in a data warehouse, it’s easy to combine it with other business data stored in other tables. We use BigQuery at Mixpanel to calculate certain advanced business trends that span systems of record. For example, “how should we assign CSMs to accounts to ensure all customers get great service, while maximizing retention and growth opportunities for the business?”
Our Data Pipelines product can sync your data in Mixpanel to the top cloud data warehouses from Amazon, Google, Microsoft, and Snowflake, as well as blob stores and real-time queues.
3. Run 2,296 Mixpanel reports in a single week
That’s the record set by a long-time Mixpanel user, which translates to 328 queries run per day. Our goal is always to help you answer your questions as quickly as possible so you can get back to building your product, but sometimes there are a lot of questions!
If you are the type who likes to dig into the data, we’ve improved query speed by 33% in the last year, from an average of 1.2 seconds to 0.8 seconds. We know every millisecond of your time is valuable, and want you to be able to answer a series of questions on the fly, without throwing off your whole day.
4. Segment users based on actions they don’t take within your product, but should
One of Mixpanel’s most powerful features is the ability to create user cohorts based on certain behaviors, and use that information to nudge users towards value moments in your product.
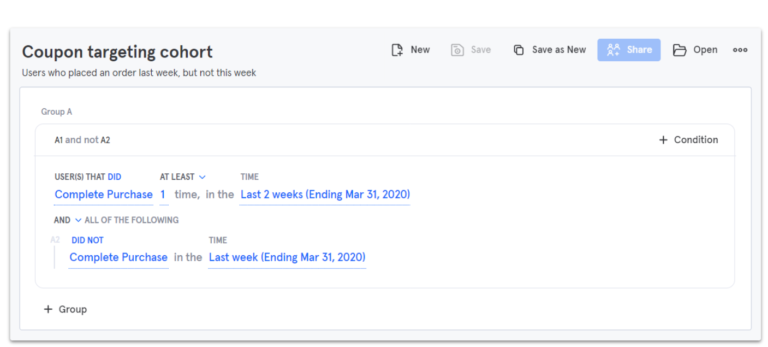
Known as behavioral segmentation, many product teams use this functionality to better understand who their ‘power users’ are based on specific actions taken at unique intervals—like ordering a meal at least once per week.
But what you might not know is that Mixpanel is the only product analytics tool in the market that lets you define cohorts of users who did not perform specific actions that you deem important. For example, users who placed an order last week, but did not this week. From there, you can do things like sync the cohort to your engagement marketing tool of choice to deliver a coupon via email or push notification.
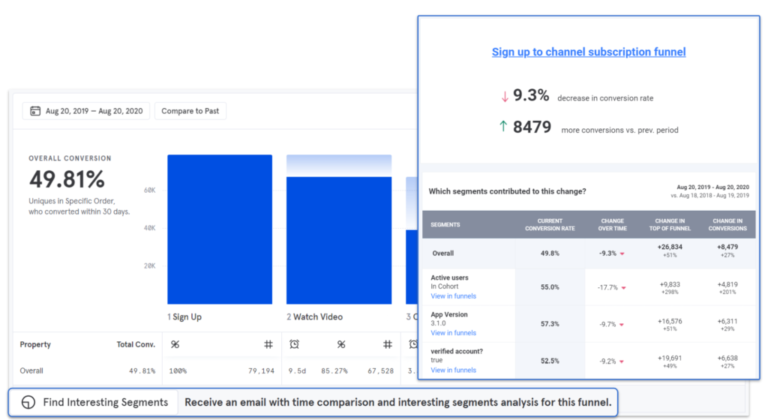
5. Ask Mixpanel to automatically segment a funnel by every available property, then send a list of high- and low-converting segments to your inbox
At your request, Mixpanel can surface segments that disproportionately contribute to conversion rates—either positively or negatively. Beneath any funnel, click the “Find Interesting Segments” button and you’ll get an email showing the results within a couple of minutes. It only includes statistically significant segments, so you know your results will be actionable.
For example, if you’re charged with driving new subscriptions to your video streaming service, Mixpanel could tell you which platforms and regions are worth further investment in terms of product development and advertising.
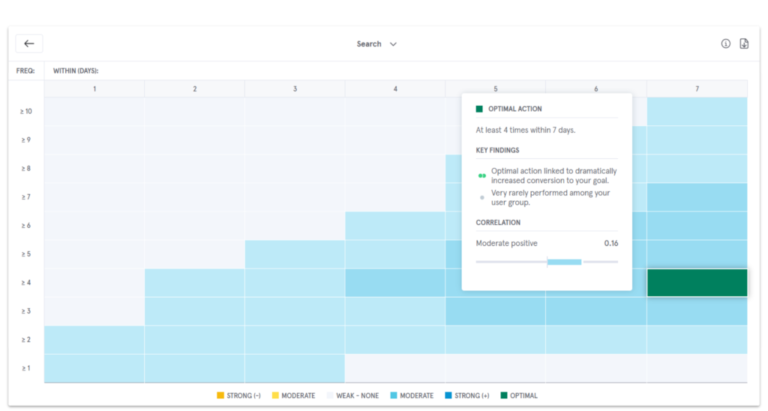
6. Find your own “7 friends in 10 days” metric, then measure and monitor it
Facebook provided the prototype for activation metrics by famously finding the tipping point that gets their new users to stick around in the long run. With Mixpanel’s correlation analysis tool, Signal, you can find your own “aha” moment. Simply input a goal, like second-week retention, and see which series of actions typically leads users to that outcome. Here‘s what our customer, PatientPing, did.
From there, it’s important to keep tabs on how your metric is trending. Mixpanel lets you define the metric in the cohort builder, then create a time series in Insights to follow its status at any point in time. This capability is not available in other product analytics solutions and applies more broadly to other Growth KPIs, such as stickiness and power usage.
7. Collect enough data in a month to fill over 100 million floppy disks
A customer running a video streaming platform once ingested 95 billion data points into Mixpanel during the month of an international sporting event. If we were still in 1982, it would take 131,944,444 brand new 3.5-inch floppy disks to store all the data. That’s a lot of disks.
To ensure you can make use of all your data quickly, at any volume, we introduced a feature called query-time sampling. It gives you all the performance benefits of ingestion-time sampling—the common approach—but without dropping data that you’ll need for accurate decision making and behavioral targeting.
8. Send laser-targeted messages and assess their impact via bi-directional integrations with best-in-class messaging partners
Timing and targeting are everything in marketing. I’ve been in the field my entire career, and in the past would roll my eyes at the common trope, “send the right message at the right time.” Mixpanel can be used in combination with leading messaging tools like Airship, Iterable, OneSignal, and many more to send in-app messages at critical moments in the user journey.
For example, you might choose to encourage engaged users to rate an app after they complete a specific action, like sharing a comedy video or building a photo album.
With Mixpanel’s new bi-directional integrations with many best-in-class messaging partners, you can even send events and cohorts corresponding to your messages back to Mixpanel, and analyze them along with product data to understand which messages worked, and what impact they had. Then, tweak your messaging for even more effective and personalized cross-channel communication. Measure, refine, repeat—and watch user engagement grow.
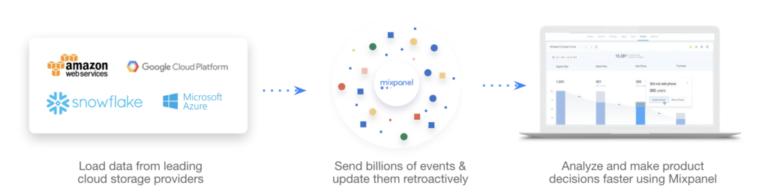
9. Skip the additional SDK and load data into Mixpanel from your cloud storage
Let’s run through a quick scenario:
Your company uses a cloud storage provider (like AWS, GCP, Snowflake, or Azure) to join many data sources together in one place, and it’s your “source of truth.” Your data engineering and analytics teams spend a lot of time maintaining it, and everyone trusts the data (for good reason).
The catch is that you want to do ad-hoc product analysis, like building funnels, flows, and retention reports, which is a pain using SQL or BI, but easy with Mixpanel.
Now, you can use the data your company trusts within Mixpanel, through a feature called Cloud Import. All it takes is dropping your event data into a shared cloud storage bucket, and customizing a few settings—then Mixpanel will take care of the rest. You can even edit events retroactively, so that when data is enriched or changes are made in your warehouse, Mixpanel users have access to the latest numbers.
Customers are using Cloud Import to load hundreds of billions of events, so we’re confident it can stand up to your toughest test.
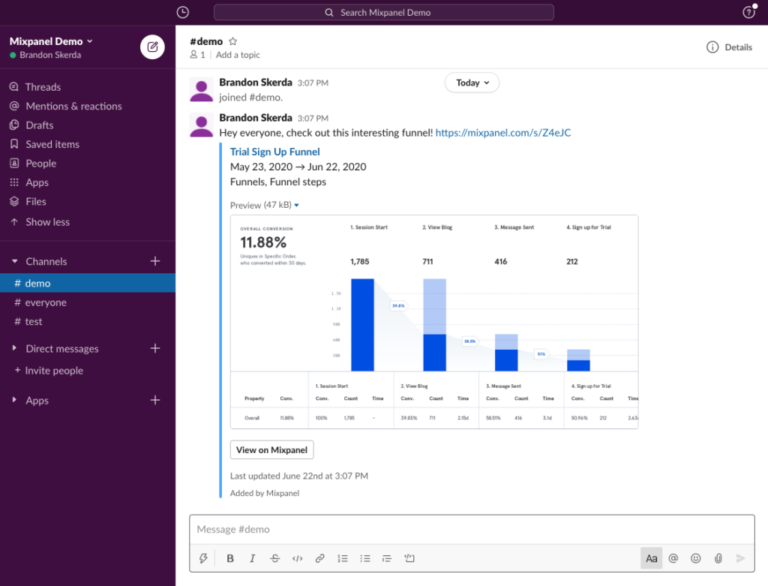
10. Use our Slack integration to share reports with your team—even if they don’t use Mixpanel
In the new reality of remote work, most of us are messaging colleagues all day long. It’s how we collaborate.
When you drop a Mixpanel “short link” into a direct message or channel in Slack, it will unfurl and show a preview of the report—even to those without a Mixpanel account.
Currently, this applies to the Insights, Funnels, Flows, and Retention reports.
11. Track any events you want, without worrying about extra costs
For 20+ years, the analytics industry was charging for data points collected, or, in simpler terms, storage. As software continues to eat the world, there are more and more critical online interactions with customers that every business needs to track. Without knowing all the details about the customer experience, you are playing with a hand behind your back in making it great.
For this reason, and many others, we transitioned to a Monthly Tracked Users (MTU) pricing model last year. We think you’ll find it better matches with the value your business creates. It’s also more predictable should you be fortunate enough to successfully increase user engagement.
12. Power analytics for gamified learning and digital jukeboxes
We nerd out when we see cool new analytics use cases. They’re the manifestation of how technology and the world are changing. Regardless of what your product is, if it connects to the internet, we can help you track the experience, analyze the data, and make it better for your customers. In case you’re looking for inspiration, here are some of the most interesting use cases from our customer story catalogue:
- Building chatbots that provide human-like interactions
- Teaching kids to code through video games
- Changing the dynamics of online dating
- Equipping police officers to securely collect evidence
- Injecting innovation into the insurance industry
- Improving patient care with communication technology
- Driving up standardized test scores
Want to stay in the loop? Follow us on Twitter @mixpanel to be the first to know about new features when they’re released.