Introducing Mixpanel’s Company KPIs Dashboard template
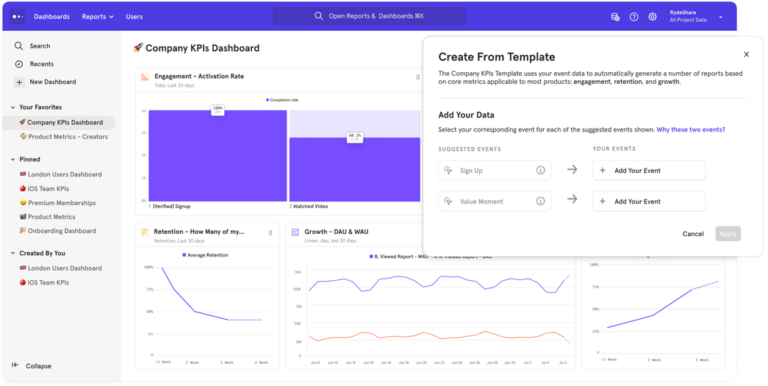
When you open Mixpanel, you may have an overarching idea of the metrics you need to measure. But you may not know exactly where to start. To take the guesswork out of measuring the right metrics, today we released the Company KPIs Dashboard template—nine out-of-the-box, fully customizable reports that make it easy for anyone to measure engagement, retention, and growth metrics.

Click on the Dashboard image above to see the template in action.
Less effort, more value—faster!
Product analytics tools like Mixpanel alleviate the hassle of SQL queries and lengthy data analyst queues and instead put the power into the hands of the user with fast, convenient, and easy-to-understand analysis. Though some product analytics tools track everything (you can read more about the caveats of that approach here), most require creating a detailed tracking plan.
Mixpanel has always made tracking complex data relatively easy. Now, we’re making it even easier: You only need two events—a signup or session start event and a value moment event—to get started. In just four clicks, users go from a blank slate to nine comprehensive and customizable reports that are relevant across most products, companies, and industries. (P.S. We still highly encourage you to do the full implementation as your company grows and your analysis needs become more complex).
Not only is this a great starting point for users who are implementing for the first time, but it’s proven to be a terrific shortcut for more seasoned Mixpanel users as well. Since all nine reports can be further segmented, customized, and saved, you don’t have to build your analysis from scratch, and you don’t need to choose between power and ease of use either.
Have teammates who are new to product analytics? The template is designed to help get new users up and running quickly, which helps minimize onboarding time.
And as an added bonus, we’ve also introduced a set of Mixpanel Primers on engagement, retention, and growth. These articles combine how-to guides for interpreting and engaging with the nine reports in the templates with more strategic insights into these metrics. Best of all, you can find all three primers linked directly from the template dashboard.
Metrics that matter
The new template takes the guesswork out of identifying and tracking your metrics by giving you a ready-made, customizable dashboard that tracks metrics across growth, engagement, and retention, helping you easily answer questions like:
- How many users are experiencing value in my product?
- Who are my most engaged users?
- Which channels generate the most signups?
- How many of my engaged users come back?
It also encourages users to look at their metrics more holistically. While ad hoc analysis can be terrific for answering one-off questions, the Company KPI Dashboard illustrates the value of looking at your metrics holistically. Perhaps you notice that your signups are trending upwards (yay!) but if you don’t look at your other metrics alongside it, you might not notice that your retention is dipping (yikes!). What good is a bunch of signups if those users aren’t sticking around?
This is why keeping a steady pulse on your metrics “command center” is crucial; and we make it easy for you to do just that, so you can lean into what’s working and pivot quickly on what isn’t.
A note for startups
The Company KPIs Dashboard template is designed to be a startup’s secret weapon for creating investor-worthy dashboards that showcase the metrics they care most about. Investors often ask for very specific metrics like activation, retention, virality, etc. If a startup depends on logs, GA, server metrics, or appDB for numbers, they will struggle to collect this data efficiently (if at all), let alone translate it into a presentable dashboard. This template puts the answers at your fingertips. Coupled with our suite of other features, like public dashboards, modifiable text cards with rich formatting, and fully customizable reports, startups can communicate their product’s story and unique value in order to help secure that next funding round.
Kelvin Yu, a senior engineer at fintech startup Zage, noted: “Mixpanel’s KPIs Dashboard Template put metrics at our fingertips that we didn’t even think to measure. It only took five seconds to set up, and the reports were very easy to understand and take action on.”
Get curious, confident, and inspired
Lastly, taking the heavy-lifting out of analysis with an easy-to-use template is only part of the equation. Hopefully, the template creates a foundation to explore and customize your analysis so you can start building your knowledge and growing confidence to explore further, go deeper, and turn more insights into actionable results. Our Company KPIs Dashboard provides a strong base of knowledge, regardless of whether you’re new to analytics or a seasoned pro.
We designed our new template to give you precisely that foundation, complete with detailed report titles that tell your what question you’re answering and which metric it maps to and report descriptions that provide further context on the analysis and why it matters.
Learn more
- If you’re already a Mixpanel user, you can jump right into our Company KPIs Template with this nifty shortcut.
- If you’re not using Mixpanel, but you want to give the template a try, you can sign up for your free account.
- Read our help doc to learn more about how the Company KPIs Dashboard Template works.


