

Descriptive analytics: Understanding what happened in your data

Descriptive analytics summarizes historical data to provide insights into what has happened and what is happening in your business. By organizing, visualizing, and interpreting past data, descriptive analytics helps businesses understand performance patterns, identify trends, and establish benchmarks. While more advanced analytics build on these insights, descriptive analytics remains essential for data-driven decision-making.
Ever feel lost trying to cook a fancy meal? You have a pile of ingredients in front of you that require different slicing and dicing, and no idea how it all fits together. But as you slowly start cooking, what was once a bunch of onions and carrots takes shape into a delicious dinner.
Descriptive analytics does something similar to your data: It allows you to take mountains of unsorted data and use that information to create a clear, complete view of your business that makes sense (though sadly, it probably doesn’t taste as good). By organizing, visualizing, and interpreting past data, descriptive analytics helps businesses understand performance patterns, identify trends, and establish benchmarks. Without descriptive analytics, all you have is ingredients, with no clear understanding of how they come together.
So let’s talk about descriptive analytics.
What is descriptive analytics?
Descriptive analytics is a type of analytics that analyzes past and current data to find patterns, surface trends, and understand relationships within the data that would otherwise be impossible to see.
As the name suggests, descriptive analytics helps you understand and describe what is going on. It helps businesses answer historical questions like “What happened?” “When did it happen?” “How much did it happen?” and “How did it happen?”
Descriptive analytics doesn’t tell you why something happened, or if it’s likely to happen again. But looking at past data in the aggregate and understanding how it’s evolved can help you make better, data-driven decisions or spot unusual fluctuations that warrant further investigation.
Let’s look at an example of descriptive analytics.
Say you’re an ecommerce clothing company. You have mountains of historical data, including purchase data like products purchased, purchase dates, customer demographics, user behavior, and any events that you’re tracking.
Without descriptive analytics, all of this data sits in an unsortable pile—maybe it lives in your data warehouse, or it’s siloed in several different tools across your tech stack. Either way, data without analysis serves no purpose. It just sits there, gathering digital dust.
Descriptive analytics can help you understand this data and use it to drive better business decisions. Are there products that are selling better than expected, or worse? Have sales declined (or increased) in unexpected ways? How does seasonality affect your business? When you segment your customers and look at different cohorts, what patterns or unexpected trends do you see? Which channels drive the most customers? Where do customers click immediately before a purchase? Or before abandoning their cart?
All of these questions can lead to valuable insights about your customers and your business and help you see where to dig deeper to understand why things are happening (that’s the next step, diagnostic analytics). Descriptive analytics provides a foundation for deeper analysis.
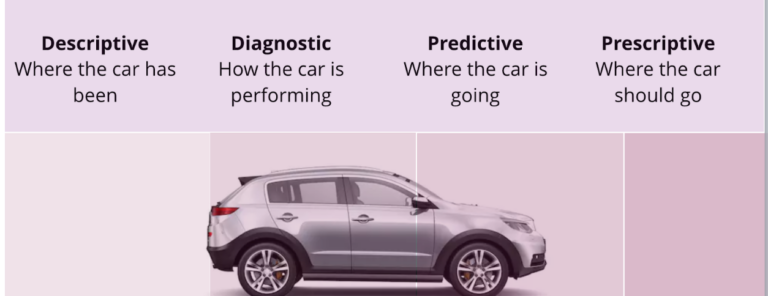
The analytics hierarchy: Descriptive, diagnostic, predictive, prescriptive
Descriptive analytics is the foundation of your business data analysis and lays the groundwork for more advanced analytics:
- Descriptive analytics tells you what has happened and what is happening
- Diagnostic analytics helps you understand why something is happening
- Predictive analytics uses historical data to predict what will happen
- Prescriptive analytics helps you determine if/what actions need to be taken based on those predictions
Predictive analytics and prescriptive analytics are powerful forecasting tools—when used well. But despite the abundance of data, analytics that hope to anticipate the future are still subject to human error and the limitations of data modeling. There are just too many unknowns, assumptions, and beliefs for certainty: The market can always change, and consumer preferences can shift at any moment. It’s important to understand that assumptions always can be wrong and to build that uncertainty into your calculations.
Building a descriptive analytics process
Descriptive analytics starts with data collection and aggregation. If you already have a digital analytics platform like Mixpanel, tools like Warehouse Connectors will help you bring warehouse data into Mixpanel automatically. That way, you can combine business data from a variety of sources into a single, self-serve analytics platform.
Duplicate or inaccurate data can tank any analytics efforts, so it’s important to make sure data is clean, reliable, and well-organized.
Once you have data collected and organized, you need the right tools to segment it, analyze it, summarize it, and visualize it. Segmentation is one of the most powerful ways to get more from your data: You can group users by behavior (new users vs. churned), demographics, (age, gender, etc.), geography, or technographic data (iPhone vs. Android users). Slicing and dicing data this way can surface interesting insights.
Here are a couple of examples:
- A SaaS app segments iPhone and Android users, and notices that many Android users are dropping off at the same point in a funnel: This could indicate a bug or UX problem.
- An ecommerce company realizes that customers who found them through Instagram are more likely to complete a purchase than those who came through other channels: They can use this information to inform strategy and allocate budget in the future
Tools like reports and dashboards make descriptive analytics accessible and useful to your entire organization. Reports and dashboards are powerful visualization tools that help you share information gained from descriptive analytics and empower your organization with data.
Self-serve analytics platforms like Mixpanel make descriptive analytics more accessible, but they also allow product and marketing teams to dive deeper into diagnosing why something is happening, without additional support from data analysts.
Moving from descriptive to diagnostic analytics
Observing what is happening and understanding it with descriptive analytics is the first foundational step to any analytics practice. Once you have that foundation in place, diagnostic analytics (understanding why something is happening) takes you a step closer to optimizing it. It’s the combination of descriptive and diagnostic analytics that allows organizations to make smart, data-informed business decisions.
As we mentioned earlier, descriptive analytics might show you where users are dropping off, which behaviors lead to conversions, or which features your users are engaging with—and which ones they’re ignoring.
But diagnosing why something is happening is what allows you to replicate the outcome (if it’s positive) or fix the problem (if it isn’t).
If users aren’t engaging with a feature, why not? Maybe the product team needs to change the icon or make it more obvious what that feature does.
If X behavior is correlated with a higher conversion rate, how can we nudge more people to take that action?
Descriptive analytics gives you insights into what is happening and allows everyone to get on the same page, working from the same data. Diagnostic analytics allows you to move past observation and begin problem-solving.
Common descriptive analytics metrics and KPIs
Organizations use descriptive analytics to keep a pulse on their business. Common descriptive metrics and KPIs can help spot what’s going well and what isn’t for different business areas.
Business performance metrics
Tracking important revenue metrics like total sales revenue, revenue growth, expenses, and profitability and using descriptive analytics to understand how those metrics relate to each other is one of the most valuable things you can do for your business. Using descriptive analytics to look at cash flow and cost structures can help you make decisions about budgets and pricing.
You can also track operational metrics like production data, inventory (if relevant), processing times, and key performance indicators (which will vary depending on your industry).
Product metrics
PMs and product teams use descriptive analytics to get insights into product performance, user behavior, and how users are interacting with their product. You can track things like engagement, and conversion rates, as well as retention and churn. All of these metrics give you valuable information about product performance.
Marketing metrics
Marketers and marketing teams use descriptive analytics to track marketing performance, including website analytics metrics like page views, campaign performance, and channel performance. You can also use descriptive analytics to analyze funnel performance and user flows.
Comparative analytics
Comparing two different data points and seeing how they relate to each other helps contextualize performance and understand what your metrics mean as part of the bigger picture. Descriptive analytics are great for period-over-period comparisons (revenue growth in Q1 vs. Q2, for example) or benchmarking (how does our performance compare to industry averages?).
Common challenges with descriptive analytics
Descriptive analytics is a valuable tool for understanding your product, marketing, and organization data. But like any analytics solution, descriptive analytics comes with its own set of challenges.
One of the first potential issues that product managers, marketers, and data analysts who want to use descriptive analytics need to contend with is data quality and collection. It’s important to ensure that data is clean and accurate. Data governance tools like a Lexicon to describe and label events can help keep your data organized, and data volume monitoring can help spot implementation issues early.
Once you have the data, it can be hard to know exactly what to do with it. Analysis paralysis and metric overload are common problems for people who aren’t experienced with handling large amounts of data. The key is to build a tracking plan starting with the outcomes you want to achieve and what you want to learn, then work backward to identify the metrics that will give you those insights. Proper set up and implementation is key. Which brings us to our next section…
Implementing descriptive analytics effectively
Getting the most use out of descriptive analytics starts even before implementation.
First, it’s important to establish clear measurement objectives. You don’t want to track every single event or piece of data just because it’s available—that’s the easiest way to drown out the information you actually need and make it harder to gather insights. Instead, think about what you want to learn and how it will support your business, then select the right metrics to track in order to meet those goals. Once you have a plan in place, you can start to design your tracking schema.
FAQ
How is descriptive analytics different from diagnostic analytics?
Descriptive analytics is the foundation of any analytics process. It looks at historical and current data to understand what is happening. Once you have all of the data digestible and analyzed, you move on from understanding what happened to investigating why it happened. That’s the next step, also called diagnostic analytics.
What are the most important descriptive metrics for digital products?
The descriptive metrics that matter most for digital products will depend on your organization and your goals. Descriptive analytics can help you learn more about overall business performance (revenue, sales, growth, etc.), marketing performance, product performance, and user engagement. It’s also a valuable tool for benchmarking and comparing various data points across time periods, to spot trends or see how performance has evolved.
Do I need special tools to implement descriptive analytics?
To implement descriptive analytics, you need a digital analytics platform that is powerful enough to ingest large amounts of data and that can connect to your data warehouse (or wherever your data is stored).
How often should descriptive analytics reports be updated?
Ideally, you want to use real-time (or near real-time) data to make business decisions. Otherwise, you risk making decisions based on outdated information that’s no longer relevant. Tools like Mirror can help you sync your data from your data warehouse and solve data distrust due to event immutability.