
Funnel analysis: Find conversion problems

Whether you’re trying to measure how effectively you’re acquiring users or trying to make sense of in-product user journeys, funnel analysis is a cornerstone of understanding campaign performance and product health.
But before we get ahead of ourselves, let’s take a look at what funnel analysis even is and how Mixpanel can help you make the most of it.
What is funnel analysis?
A funnel is a sequential series of steps that visualize a user flow to conversion. These steps can happen inside or outside your product, and can lead to any form of conversion – a signup, a purchase, or completing a level in a game.
Funnel analysis is the process of understanding who converts across each step of your funnel, and why, so you can discover the key drivers of conversion and optimize funnel performance.
Importance of funnel analysis
It’s fairly obvious that improving conversion rates matters, but funnel analysis goes beyond just tracking conversion rates. Funnel analysis enables you to understand how your conversion rate varies by any user attribute or behavior, so you can figure out which users are more likely to convert, what causes drop-off, and what dropped-off users do instead. This not only allows you to improve funnel performance but also find potential flaws in critical funnels and user flows.
Defining a funnel
Depending on the complexity of a product, or the question you’re trying to answer, a funnel can be incredibly simple or overly complicated. Which is why defining a funnel correctly is extremely important to ensure accurate insights from your analysis.
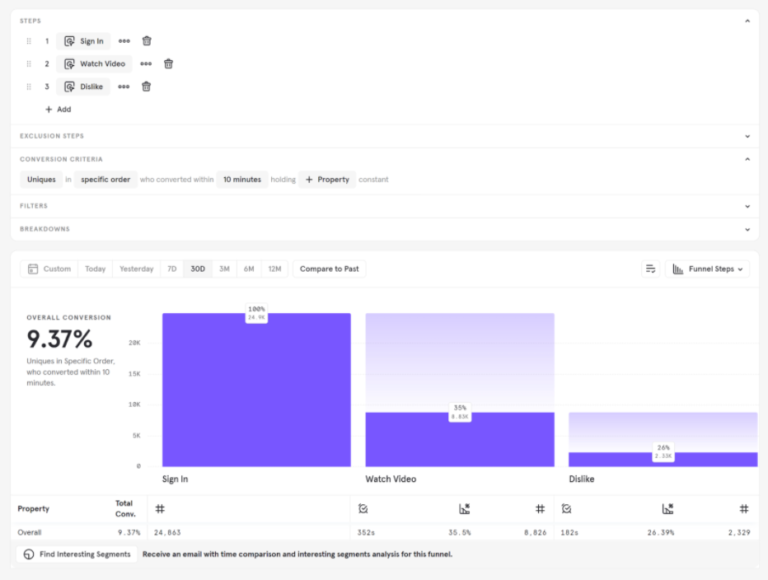
Consider a media and video sharing product. As a product manager you’ve been given some feedback — many people find the short form content on your platform unpleasant. Funnels lets you validate this feedback with data; you can start by creating a simple funnel with the following steps:
- Sign in
- Watch video
- Dislike video
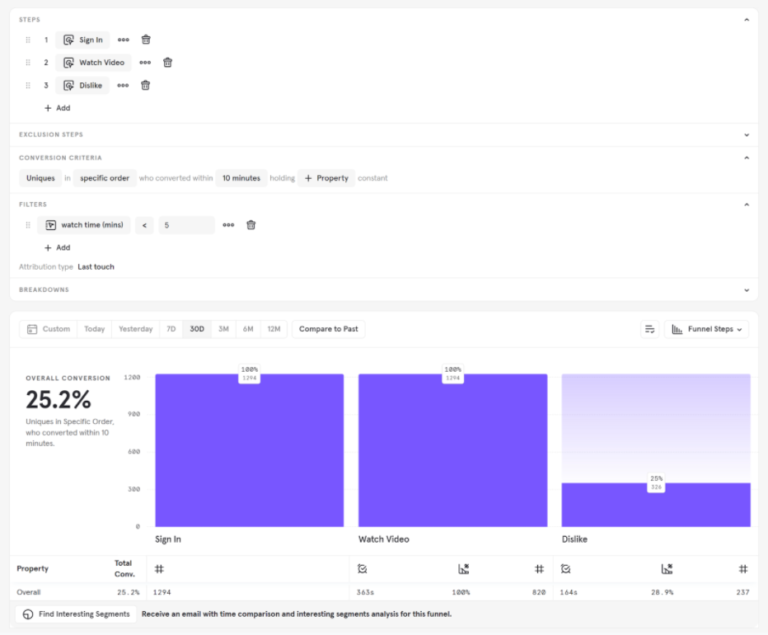
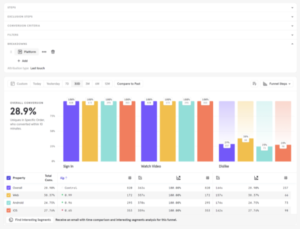
But, this funnel considers all videos on your product. To count only short form videos, you can add a filter to this funnel — we added one for videos with a watch time of less than five mins, but Mixpanel lets you be more specific by filtering based on whatever video duration you consider as “short form”.
To truly get an understanding of people who dislike short form content however, you’ll need to exclude users who “liked” a video after watching it before they disliked a separate video. This can be done by adding an exclusion step between steps 2 (watch video) and 3 (dislike video), so you can narrow down the funnel even more.
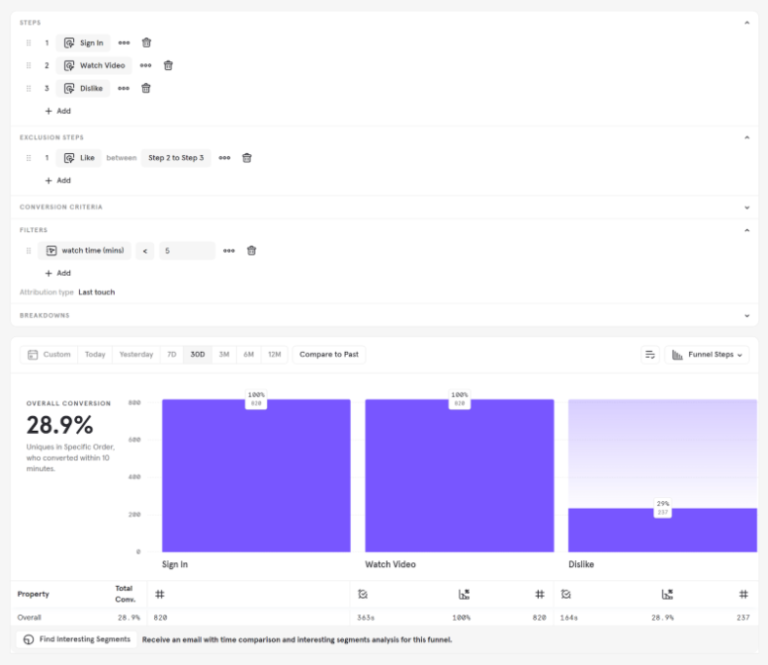
This gives us more accurate numbers on exactly what we’re looking for.
Seems like 29% of users that view short form content and react to it instantly dislike it. Having learned this, you can benchmark it against the dislike rates across other video categories and see if this is indeed higher than normal for your product.
Ultimately, every product and analysis is different, and to get to real insights you need to ensure you’re answering the right questions accurately. Funnels empower you to do so with many controls to tweak your funnel exactly the way your analysis needs:
- Counting method: You can count users that entered your funnel as “Totals” or “Uniques”. Uniques counts all actions by the same user as one, while Totals considers each action separately (which is useful for calculating repeat conversion, like in a purchase funnel).
- Conversion window: Determines the amount of time a user has after entering the funnel to be counted as a conversion.
- Conversion ordering: The flexibility in the sequencing of a user’s actions. “Specific order” funnels users to complete each funnel step in the exact order you define, while “Any order” funnels show the conversion rate for all users in your funnel—regardless of the sequence of steps they take.
- Exclusion steps: The actions you don’t want users to take between funnel steps. Users who do these actions are excluded from your funnel.
- Constant properties: Holding a property constant in a funnel ensures that conversions are only counted for users that retain a constant value for a given property or attribute (like a page url, or a device ID) for each step in order to convert.
However, analyzing overall funnel performance can only help with a broad understanding of what users do, and can also be misleading at times. Which is why you need to go further by segmenting your funnel.
Finding key drivers of conversion with segmentation
Once you’ve designed a funnel to analyze, the next step is to go beyond simple funnel analysis by breaking your funnel down by different user characteristics or behaviors, so you can understand which user segments are most or least likely to convert.
For example, we can try to see if more users dislike short form videos on a different platform. You can do this by adding a “Platform” breakdown in Funnels.
Seems like Web users do dislike short form content more so than users of your Android or iOS apps. Perhaps the web experience is bugged for short videos, or maybe there’s a difference in the type of content web users expect? Now that you know who’s causing an increase in dislikes for short form videos, you can finally start fixing the problem.
Optimizing conversion and iterating on what works
Funnel analysis gets you insights and hypotheses about which users do (or don’t do) specific things in your product, and why. However, improving your conversion rates requires you to act on these insights.
You can plan targeted experiments or engagement campaigns to test out each hypothesis and improve your user experience. You can test out a different UI at various steps in your funnel to see how they affect conversion rate, or you can leverage targeted messaging to revive dropped off users before they churn for good.
Make informed changes to your products with funnel analysis
Because acquiring and converting users is a critical process in ensuring consistent growth in your user base and customer lifetime value, you need to ensure that you’re as effective as possible.
Whether it’s making changes to your signup or onboarding flow, running perfectly timed re-engagement campaigns, or fixing bugs that break a user flow in a funnel, funnel analysis is a great starting point to help you make informed decisions that improve your users’ experience while improving your conversion rates.
However, conversion rates aren’t the only metric you need to care about. Once you’ve acquired users, you need to understand how your product gets used and how you can increase user retention.
Ultimately, the best way to iterate on your product is to track multiple product metrics and understand user behavior deeply. Product analytics empowers you to do that, and so much more.
For an overview of advanced funnel features, check out Mixpanel Docs.