


More analysis and customization: Here’s what you can do with Mixpanel’s latest features

As our customers’ tech stacks, business needs, and data strategies have evolved, Mixpanel has set our sights on evolving alongside them. We've done that by constantly pushing new features to give you more analysis power and customization.
We’re especially excited about the things our product team has been hard at work on recently to improve the Mixpanel experience for our customers, including large, show-stopping announcements and smaller, iterative updates.
As a Mixpanel customer account manager, I can speak firsthand to the fact that many of our releases here in 2024 have come directly from customer feedback, so we know they’re absolutely going to make your days of building and making business decisions a lot better.
Let’s start with the big one:
Session Replay
I have a number of quantifiable metrics measuring user behavior within Mixpanel, but where does this fall in the overall story of my users’ behaviors in my product?
You love to tell a story with your data, and so do we. It's why we've made Mixpanel the fastest and easiest way to understand the full picture of your user journey.
With Mixpanel Session Replay, you can see all aspects of your users’ behaviors in a single tool and ultimately make better product decisions by combining the quantitative power of Mixpanel analytics with the qualitative user insights that session replay functionality can provide. With both qualitative and quantitative data points in Mixpanel, it’s easier than ever to understand where customers drop off and then follow up to find out why.
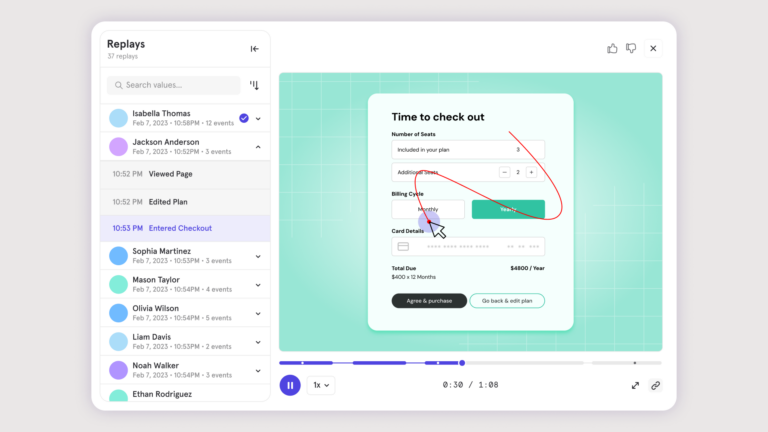
Looking at a funnel and want to see what users are doing when they drop off? Open up a funnel and click “View Replays” to see conversion vs. non-conversion behavior.
Want to troubleshoot a user experiencing issues with your product? Have your support or product teams review their replay/journey to find the root issue and quickly diagnose it.
Seeing a massive rise in certain user behavior? View their replays and find out in mere minutes what might be causing the change—all while still gleaning the same insights you know and love in Mixpanel!
Warehouse Connectors and Mirror mode
Have data in your Snowflake, Redshift, Data Bricks, or BigQuery that doesn’t exist in your current Mixpanel instance that you’d like to access and analyze without needing to ask another team?
Great! We made it easy for you.
With Warehouse Connectors, we’ve made it easier than ever to automatically pull data from your source-of-truth warehouse into Mixpanel to analyze and capture insights. This allows teams like product, marketing, engineering, design, revenue, and others to effortlessly visualize their users’ behavior and analyze results from releases, campaigns, and other initiatives. And that means more teams throughout the organization can use Mixpanel to make better decisions.
This can be applied to finance teams wanting to view revenue metrics without having to ask another team for answers or when marketing teams want to break down their ROI data themselves from the warehouse—the sky’s the limit.

In addition, with Mirror mode, you can now get self-serve answers on only the freshest of data. If anything ever changes in your warehouse, Mixpanel stays in perfect sync and reflects updates with no work on your part. Once you’ve set up the connection, changes made to your data in your warehouse tables are now automatically “mirrored” within your Mixpanel. Set it up, and watch it run—it’s that easy.
Chart customizations
Wish you could have more control and customizability over your Mixpanel reports and Boards?
As a type-A, visually oriented person, I can relate.
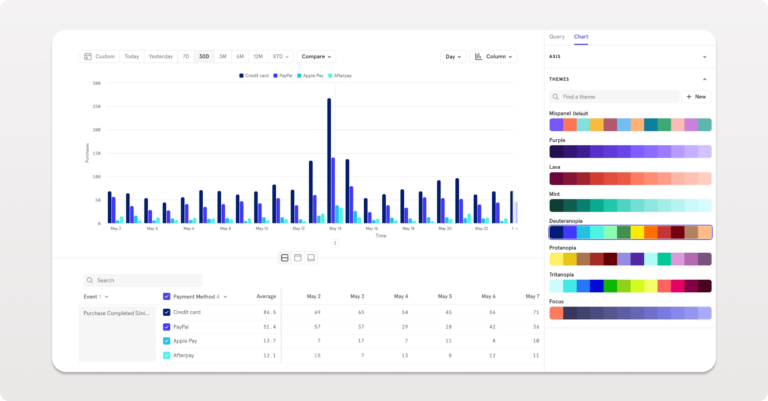
Using chart customizations, you can now tailor axis titles, ranges, precision, and units to perfectly match your preferences and showcase your insights exactly as you envision them. If you prefer a little more visual flare specific to your liking, brand color scheme, or specific metrics, customize the color theme for individual reports or your entire project. This can be applied when sharing reports with your investors and executive suite to align to your company’s color scheme and metric minimums and maximums. Or you can simply spruce up data internally to make your day of reviewing reports a whole lot smoother.
Plot Insights, funnels, and retention on the same chart
Want to track an Insights report metric alongside funnel or retention behavior to tie certain metrics to specific behaviors without toggling between reports or boards?
You’ve come to the right place.
You can now plot any funnel or retention metric in our Insights report and plot any combination of them together. Our Insights report just got a lot better, where you can see how any of your metrics are performing and how different metrics are doing side by side with multi-metric user behavior, unlocking access to a richer story within a single report. We’ve made it easy to answer questions within a single report, such as, “For those who never converted to viewing a product to purchasing, how does this number impact my overall sales?”
Saving standard funnel and retention behavior
I just spent an hour creating a formula, funnel, or retention chart to be exactly what I want to visualize and analyze, but having to recreate this behavior across Mixpanel’s reports is a real headache and time drain.
Too true. Or at least it used to be.
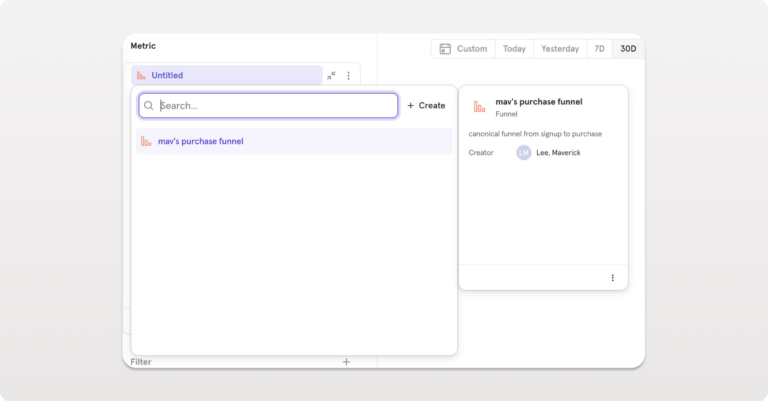
Once you’ve drilled down your reporting to identify a specific user behavior, you can now save a funnel or retention behavior definition and reuse it across your reports. This unlocks standardization on your behavioral definitions, allowing you to feel confident you aren’t missing any changes if you need to update a definition. Not only does this save time from not having to redefine your funnel or retention behavior for every report, but similar to our cohorting functionality, this makes duplicating your efforts across reports a matter of a few clicks rather than a few hours.
Event context
Having trouble deciding which event is tracking the metric you’d like to analyze?
We’ve made it much easier to find.
See all of the rich context about any event within your Mixpanel’s Lexicon—or even individual reports—such as images of where the event appears in your product, frequent users of any event across teams, related reports tied to that event, or event owners who hold the keys to customization with our new event context functionality. Spend less time wondering if you're analyzing the right data, and start building reports with confidence.
All this and more to come
We take customer feedback to heart and are dedicated to making Mixpanel easy to use and your trustworthy source for analytics insights. If you have product feedback or suggestions, don’t hesitate in reaching out to your account manager or our support team!