The ABCs of data as a product manager
In the age of data and analytics, we’ve come to believe that, with enough data, we can make smart decisions and become truly data-driven. But as the global data volume has gone from big to enormous, many businesses today find themselves thinking: What do we do with it?
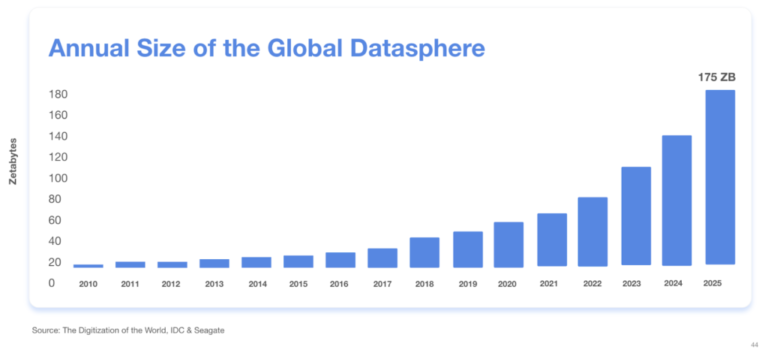
Collectively, we’ll be generating 175 zetabytes of data by 2025. And yours is among all that data—data about and produced by your customers as well as data that’s central to your day-to-day business operations. Adding to the complexity is the need to find the right tools to manage the different types of data — you can pound in a nail with a wrench, but that’s not what it’s built for.

As with many things in this life, organization is the first step to success, whether you’re looking to increase operational efficiency, improve user experience, or innovate to grow market share.
In this article, we’ll provide a framework for organizing your data that can be applied across industries and businesses of all sizes—and talk about the tools that are best fitted for specific kinds of data.

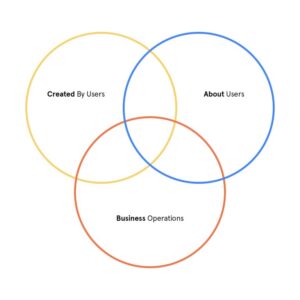
Let’s start by identifying the key use cases—what we’ll call “the ABCs”— of data:
A – About users
B – Business operations data
C – Created by users
Below, we’ll examine what each of these data categories mean, where they overlap, and how best to analyze the data once you have it. But first, let’s look at how each data type is structured, processed, and stored.
Data Type A – About Users
Data about users includes what users do and who they are.
Take a photo sharing app as an example. Data about its users would include: when a user uploads an image to the app, likes another user’s image, or comments on an image; the location from which the user is posting; the user’s name and email; and the frequency with which they interact with the app.
Product managers and marketing teams can use this data to understand how to grow, engage, and retain their user base. In today’s competitive subscription-based economy, the cost of acquiring a new user is high, so you must compensate for that with retention and lifetime value. For example, if you spend $10 on acquiring a new user, you have to make more than $10 across that user’s customer lifetime if you’re going to turn a profit.
That’s why collecting data about users is so important—it helps you understand what drives retention or causes churn. This data should be available to people at all technical levels who need to make data-informed decisions. Whenever a product manager or a marketer has a question such as “Where do my users drop off?” or “Which acquisition channel brings me users that upload and like the most photos?”, they need to be able to self-serve answers to effectively use this data.
Mixpanel was built to analyze this type of data. In Mixpanel, the actions that users perform are called events, and information (like user location and email address, etc.) is collected in profiles; this data tracking makes it easier for you to organize and analyze the data about your users—without writing a single line of code.
Data Type B – Business Data
Business data includes the process data (like usernames and passwords, login info, billing info, and pricing plans) without which your business can’t run.
Examining this data is the first step in analyzing your business’s success; without it, you have no insight into what your business is really doing or if you are generating money. Understanding this data helps you grow your business, and directly impacts revenue and your top-line metrics.
To return to the photo sharing app example, business data could include the actual images being uploaded to the app. The purpose of the app is to store and share these images, so if the images are not saved, the app does not run—and loses users.
Businesses typically want to track this data first, because it can tell you whether the business is succeeding or failing. This type of data is usually handled by a dedicated team of data analysts who use business intelligence (BI) tools. These tools (e.g., Looker or Tableau) require extensive technical skills and knowledge to operate. At the same time, they provide the depth of analysis necessary to run business operations. BI tools can answer questions like “What’s the impact of our new pricing strategy” or “How should we prioritize localization based on the revenue opportunity?”
Data Type C – Data Created by Users
Data created by users includes feedback and support emails, as well as data created because of users (such as machine-level logs created when users perform actions on your platform, crash metrics, and server-side logs.) C Data is analyzed by data scientists, machine learning, and engineering folks.
The key difference between A Data and C Data? Type A Data is data you have chosen to track about your users, while Type C Data is data your users have chosen to give you.
Businesses typically track Type C Data with tools like Medallia to answer questions such as “How happy are our customers?” or “Where should we focus our support engineering team to reduce customer support tickets?” Data scientists and engineers use this data to understand how the app or website works—or doesn’t.
Conclusion
More and more data is created every day, and understanding and analyzing it can be difficult. But for any business, it is essential to collect and use data effectively — and empower every team to use data to grow the company.
Whether it’s data about users (A), business data (B), or data created by users (C), each data type typically addresses different needs—and requires different tools. Data about users (A), for example, helps teams build better products. Business data (and the BI tools that support it) uncovers business challenges and areas of opportunity. Finally, “C” data helps businesses understand and improve customer experience.
Of course, these “ABCs of Data” often overlap, based on the specific circumstances and needs of your business. We’ve seen that images uploaded to a photo sharing app can be classified as both Data Types A and C, but they can also be thought of as Data Type B, because images are also necessary for the app’s business model. However, this framework can be useful as you scale your business and think about building a best-in-class technology stack to support a strong data culture across the entire organization.


