

AI benchmarks 2026: What usage data reveals about the next phase of adoption

Artificial intelligence has crossed a meaningful threshold. Across industries and regions, AI products aren’t evaluated by novelty or raw usage volume. They’re judged by whether they deliver consistent, measurable value inside real workflows.
The 2026 State of State of Digital Analytics benchmarks make this shift visible. The data reflects a mixture of consumer applications and enterprise tools across three AI categories: foundational model builders, AI-native product companies, and AI-augmented businesses.
AI benchmarks: how does your data compare?
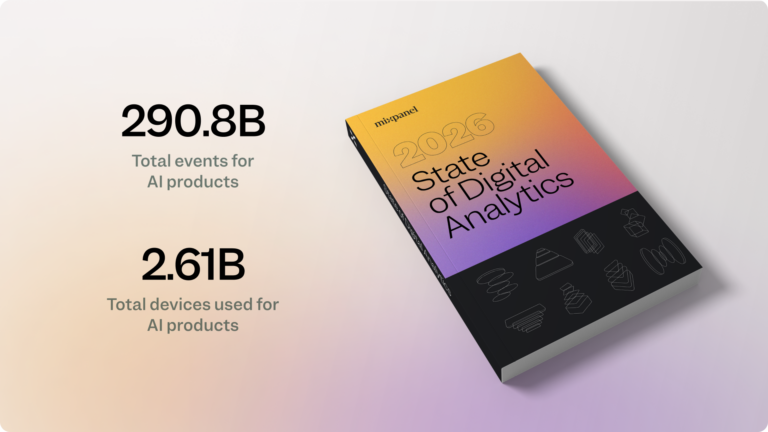
Drawing on aggregated behavioral data across nearly 290.8 billion AI events and 2.61 billion devices, our new report shows an ecosystem flying past experimentation and toward operational maturity. What matters now isn’t how often people interact with AI. It’s how effectively AI gets work done.
This article highlights some important signals from the AI benchmarks report and explains what they mean for product, marketing, data, and engineering teams building the next generation of AI-powered products.
AI usage is shifting from activity to outcomes
At a global level, AI usage patterns tell a counterintuitive story. While the number of devices using AI products grew 26% YoY, total AI events dipped slightly. Of course more people are experimenting with AI, yet they’re doing more with fewer interactions.
That pattern signals a shift from exploration to execution. Agents, automation, and embedded intelligence increasingly handle multi-step tasks without repeated prompting. In mature deployments, success shows up as fewer clicks, fewer prompts, and faster outcomes.
For teams, this changes how performance gets interpreted. High interaction counts don’t automatically indicate strong value. In many cases, declining activity reflects a product that’s working better.
Key takeaway
Adoption isn’t the primary challenge. The real work now centers on utility, usefulness, and retention. Analytics increasingly helps answer a harder question: does AI meaningfully improve how work gets done, and does it do so in a way users trust and return to?
AI adoption varies by region, driven by context not hype
AI adoption no longer moves in lockstep across regions. The data shows growth shaped by local infrastructure, regulation, and user expectations.
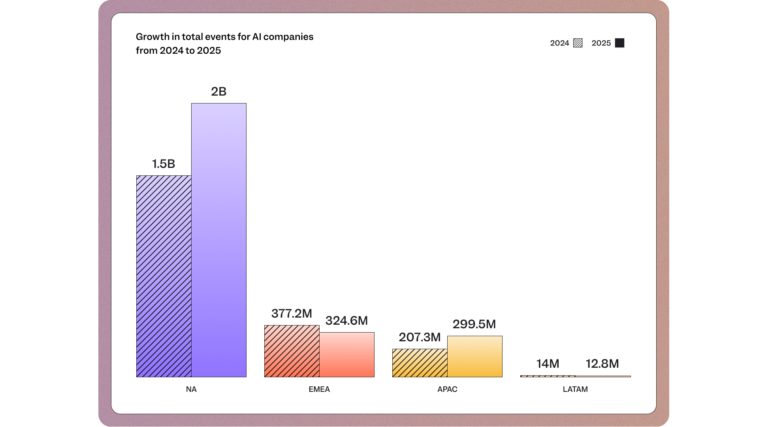
- North America continues to lead in absolute volume, representing approximately 2 billion devices. This figure signals deep workflow embedding rather than population-scale reach. That scale reflects AI being embedded into core enterprise workflows rather than driven by hype.
- APAC stands out as the fastest-growing region at 45% YoY growth, powered by mobile-first experiences, multimodal interfaces, and localization across languages and platforms.
- EMEA tells a different story. Despite a large installed base, acquisition declined 14% YoY, pointing to saturation, competitive pressure, and the growing role of governance and compliance in adoption decisions.
- LATAM highlights another constraint. User bases remain small and acquisition dropped -9% YoY, not because of lack of demand, but because latency and infrastructure friction limit sustained adoption.
AI growth now depends less on global launches and more on delivering region-specific value that works within local constraints.
Key takeaway
Scale AI growth by adapting to local constraints, not by copying global playbooks. Align pricing, onboarding, compliance positioning, and performance expectations to each region’s infrastructure and buyer priorities.
Engagement signals efficiency, not effort
Engagement metrics reveal how users experience AI, not just how often they open an AI product or app:
- LATAM shows the highest actions per user globally, exceeding 619 events per user and growing more than 120% YoY. That intensity reflects necessity and iteration. Users extract maximum value from every session, often revising outputs to overcome localization or context gaps.
- North America shows the opposite trend. Engagement depth fell 38% YoY, even as adoption remained strong. The explanation lies in agent maturity. Tasks that once required multiple prompts now complete in a single run or operate entirely in the background.
High engagement can signal friction. Lower engagement can signal efficiency. Without context, either metric can mislead.
Key takeaway
Recalibrate how you read engagement data. Investigate whether usage spikes indicate user struggle and whether streamlined interaction signals product strength. Optimize for fewer steps to meaningful results.
➡️ Download the 2026 State of Digital Analytics for complete details.
AI succeeds as either a daily habit or invisible infrastructure
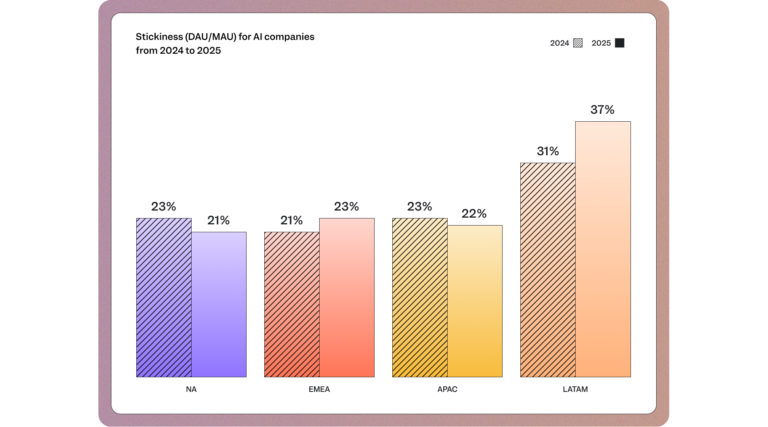
Stickiness data surfaces a sharp contrast in how AI delivers value:
- LATAM posts the highest stickiness rate at 37%, despite having the smallest daily and weekly user base. Users who clear early barriers rely heavily on AI once value is proven. For many, AI becomes essential to daily work.
- North America shows the lowest stickiness at 21%, even while leading in daily and weekly active users. That pattern reflects background utility. AI runs quietly inside workflows without requiring daily logins or manual interaction. Daily usage isn’t the universal goal. Indispensability is.
Key takeaway
Decide the role your AI product should play. Either create repeat daily touchpoints that reinforce reliance or deliver automation seamless for users to measure value by outcomes, not logins. Build intentionally for one path.
Retention is earned early through utility, not features
Short-term retention highlights where AI delivers immediate impact:
- LATAM leads in one-week retention at 11.7%, more than doubling YoY. Users who activate successfully reach value quickly and integrate AI out of necessity.
- APAC lags at 4.5% one-week retention, despite strong acquisition. Many users experiment briefly and churn before experiencing meaningful outcomes.
- EMEA shows the strongest weekly retention at nearly 74%, suggesting that retained cohorts view AI as a stable, non-negotiable part of their workflow, even if usage happens weekly rather than daily.
Key takeaway
Front-load impact by delivering a concrete result in the first interaction, then guide users toward repeatable success with clear context and built-in feedback loops. When people understand how the system works, can refine outputs, and see immediate relevance to their workflow, early week-one experiences set the ceiling for long-term growth.
➡️ Download the 2026 State of Digital Analytics for complete details.
The metrics that matter now measure usefulness, not adoption
As AI adoption matures, the metrics that matter change. Teams that scale successfully focus less on raw usage and more on value realization. Across the customer journey some metrics to consider tracking include:
- First-Session Time to Value
- Time Saved per Agent Run
- Activation to Retention Lift
- Feature-to-Value Ratio
- Signals of long-term defensibility
…and many more in the report! These metrics connect product performance to business outcomes, revealing whether AI has become infrastructure or remains an interchangeable tool. Analytics now act as the control layer for AI strategy, separating durable systems from disposable experiments.
The next phase of AI belongs to teams that measure value
AI adoption has accelerated, yet what differentiates teams going forward is how well they translate intelligence into durable utility. That means designing for transparency, context, and human oversight so AI systems remain useful, trustworthy, and resilient over time.
The comprehensive benchmarks report provides a data-backed view into how AI products perform across regions, industries, and maturity levels. For product, marketing, data, and engineering teams, it offers guidance for what success looks like in this next phase.As AI moves from experimentation into infrastructure, the teams that win are the ones that know what to measure and why. Explore the full AI benchmarks in the 2026 State of Digital Analytics report.