

30+ AI product metrics to track today

Measuring an AI feature with pageviews is like grading a conversation by word count. The number tells you something happened, but it doesn’t tell you whether the conversation was any good.
Similarly, the measurement playbook built for button-driven products (DAU, CTR, time-on-page…) captures activity. It doesn’t capture whether an AI feature understood the user, delivered something useful, or changed their behavior in any lasting way. As AI features move from experiment to core product, that gap is becoming a real problem.
According to Productboard’s AI in Product Management report, only 40% of product teams measure AI ROI through business outcomes like ARR or retention. The other 60% are tracking time saved, which is a useful proxy, but not a direct signal for whether the AI feature is actually delivering value to both users and your company. The metrics that fill that gap fall into three categories:
- User adoption and engagement
- Model monitoring
- Business impact
Many PM teams need to track metrics across all three categories, although individual team priorities will differ when setting up tracking and benchmarking.
✅ Did you know? Mixpanel provides an AI KPI template, and you can view it here.
AI product metrics: User adoption and engagement
The foundational question for any AI feature, especially for teams adding AI to an existing product, is simpler than it sounds: are users actually engaging with this in a meaningful way?
A user can open a chat interface every day and submit exactly a prompt. Standard engagement metrics will count that as a daily active user, but in reality it tells you nothing about whether the feature delivered value.
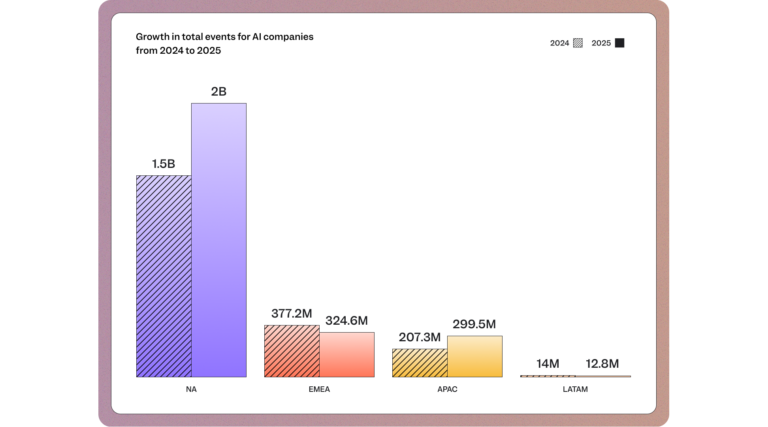
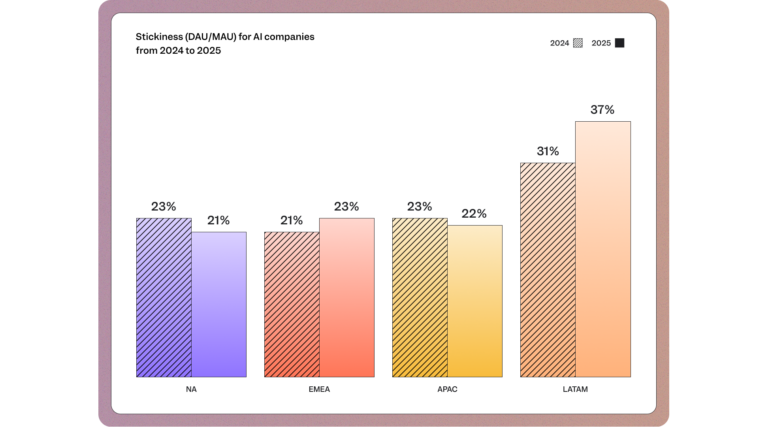
As referenced in Mixpanel's 2026 State of Digital Analytics, North American AI products have a DAU/MAU stickiness ratio of just 21% (the lowest of any global region) despite having the highest raw user volume. That gap between presence and actual engagement is exactly what standard activity metrics miss.
The following metrics speak to engagement and adoption more precisely:
Total users submitting prompts
The baseline volume metric for AI feature adoption. Unlike page views or logins, prompt submissions confirm active intent: the user didn't just open the feature, they used it. This is a top-of-funnel signal for AI adoption, and the denominator for most of the ratios that follow.
Trends in user prompts
How prompt volume changes over time. Trend data surfaces seasonality, the effect of feature updates, and early signs of disengagement before they show up in retention numbers. A spike after a model update is a positive signal; a gradual week-over-week decline is a leading indicator to investigate.
Prompts per session and per user
Not just whether users opened the feature, but how much they interacted with it. A user submitting five prompts in a session is quantitatively different from one who submits once and stops.
Average interactions per user
The mean number of prompts submitted per user across all sessions in a defined period. Where the prompts-per-session metric captures how deep a single session goes, average interactions per user captures how often users return to the feature and keep using it over time. A user with high prompts-per-session but low average interactions may be a one-time experimenter; a user with both metrics elevated is your stickiest cohort.
User adoption rate
The percentage of active users who have engaged with an AI feature in a given period. Low adoption usually points to a discovery or onboarding problem, not a model problem. The formula to calculate it is (AI Users / Total Active Users) × 100.
Power user rate
The segment of users submitting N or more prompts over a defined period. This cohort is your early signal: if the feature has real value, this group finds it first.
Power users submitting prompts
The raw count of users in your power user cohort who are actively submitting prompts in a given period. Where power user rate tells you what proportion of your base qualifies as power users, this figure tells you whether that cohort is growing in absolute terms, which matters especially if your overall user base is also expanding.
Time to first prompt
The activation metric for AI features. A long time-to-first-prompt might point to a discovery or onboarding problem, not a quality problem with the feature.
User retention after AI feature usage
Does engaging with the AI feature correlate with higher downstream retention? This metric connects AI feature quality to business outcomes. This is one of the harder ones to measure cleanly, because it requires correlating feature-level behavior to cohort-level retention curves.
Goal achievement rate
Measured via user-confirmed feedback: did the user get what they came for? Yes, this is inherently self-reported, but it’s also a direct signal that most other metrics only approximate.
User feedback sentiment and submission rate
Two signals in one: how often users voluntarily leave feedback (submission rate) and what that feedback says (sentiment). Low submission rates don’t always mean indifference; sometimes, it indicates the feedback mechanism is buried. Tracking submission rate separately from sentiment tells you whether you’re sampling enough of your users to trust the sentiment data you have.
Detailed user feedback (comment tracking)
Free-text comments are the qualitative layer that quantitative metrics can’t replace. A user who rates a response 2/5 and explains “the answer ignored half my question” is giving you a product direction signal, not just a quality score. Capturing and tagging comment themes at scale, especially for AI features with high output variance, is the difference between knowing you have a quality problem and knowing what kind of quality problem you have.
Post-response user flow
What does the user do immediately after receiving an AI response? Do they take the suggested action, refine their prompt, abandon the session, or escalate to a human?
✅ Post-response flow is one of the most direct behavioral signals for whether an AI response was actually useful: users who got a good answer tend to act on it; those who didn’t tend to re-prompt, leave, or search for the answer somewhere else.
Error and timeout rate
Two system stability signals that belong together: error rate (the percentage of AI requests that fail outright) and timeout rate (the percentage that exceed an acceptable response window and effectively fail the user anyway).
For AI features, a response that errors or times out at a critical moment can permanently shape a user's perception of the feature. Track both daily and set alerts for anomalies; a gradual uptick in either is often the first sign of a model or infrastructure issue before it becomes visible in satisfaction scores.
AI product metrics: Model monitoring
Model monitoring has traditionally been the domain of engineering. What’s changed with AI is that several model-level metrics now have direct product consequences; they affect user trust, retention, and revenue in ways that only show up at the product layer.
Accuracy and response quality
Consistently the most-cited metric across AI product teams, and the hardest to measure well. We see teams still using NPS and qualitative user research as proxies. These are useful but lagging indicators: by the time NPS drops, the quality problem has already been affecting users for weeks.
The emerging standard for AI-native teams is ‘LLM-as-judge’ scoring: using a separate model to evaluate output quality against a defined rubric. It’s not perfect (the judge model has its own error rate), but it's the only automatable, continuous quality signal that scales with your usage. Anthropic’s work on demystifying evals for AI agents frames this well: the goal is to make quality problems visible before they reach production, not after.
Latency
Response speed directly shapes perceived quality in text-based interfaces. For product teams, this matters more than it might seem: a correct answer that takes several seconds to arrive can feel broken to users in a hurry. Latency is a proxy for user experience in a way that has no equivalent in button-driven products, where instant feedback is the baseline expectation.
Token cost per query
Now a PM metric, not just a finance metric. As AI features approach production at scale, token costs directly affect pricing decisions, packaging architecture, and the viability of the feature’s economics. Tracking cost trends alongside engagement trends tells you whether usage is profitable or whether the unit economics break at scale.
Feedback ratio
The proportion of AI sessions in which users actively signal output quality, calculated by (Thumbs Up + Thumbs Down) / Total Sessions. This is a model health metric as much as a user behavior metric: a consistently low ratio means the quality signal you're working with isn't representative of actual usage, regardless of what the sentiment data says.
Refusal/safety rate
The share of total responses that hit a guardrail and return an 'I cannot answer'. This is a model metric with direct product consequences. Track it weekly, and correlate spikes with specific prompt categories to distinguish over-filtering from appropriate refusals. This is a PM problem that easily gets misfiled as an engineering one.
Model performance drift
This monitors whether the model's outputs are getting gradually worse as real-world usage shifts away from its training distribution, flagged when current accuracy drops more than 5% against a defined baseline.
Unlike a sudden spike in errors or latency, drift doesn't trigger immediate user complaints; instead, it shows up as subtle declines in goal achievement rate, prompt completion, and eventually retention. For PMs, it's a leading indicator, not a lagging one.
AI product metrics: Business impact
If user adoption metrics answer ‘is anyone using this?’, business impact metrics answer ‘does it matter to us if they do?’
Retention impact
The clearest business-case metric for AI investment. Retention impact aims to answer the question, “When users engage with an AI feature, does it correlate with higher downstream retention?”
A real-world example: one of India's premium streaming services, which is tracking 20–30 AI-correlated KPIs, treats this correlation as one of its core investment signals; the data from those KPIs feeds directly into decisions about where to deepen AI capabilities.
For AI metrics, measuring retention impact works the same way it does for any product feature in Mixpanel: does the user keep coming back after engaging with the AI feature? If they do, that's a strong proxy for the feature being genuinely helpful.
Mixpanel's Langfuse integration connects model-level quality signals to product behavior data, so teams can see whether output quality correlates with retention, without building a custom pipeline.
Churn reduction
The inverse of retention impact. Rather than asking whether AI users stay longer, churn reduction asks whether they leave less, calculated as Churn(AI users) - Churn(non-AI users). A negative delta is evidence that the feature is contributing to stickiness. If AI users churn at the same rate as non-AI users, the feature isn't doing the work it's supposed to.
Autonomy rate
For agent-based features, this is perhaps the most important ROI metric: the percentage of tasks fully resolved without human touch. A high autonomy rate means the agent is handling scope effectively. A low rate tells you either the scope is wrong, or the model isn’t ready for it, two very different problems that require different fixes.
Productivity gains
The core value proposition of most B2B AI features in measurable form: (Time Before - Time After) for a defined task. This metric is most meaningful when tracked by cohort (active AI users versus non-AI users) so the comparison is behavioral rather than assumed.
Revenue and conversion impact
These are worth tracking directionally too. How does the AI feature usage correlate with upgrades, expansions, or conversion events? Getting this right depends on your revenue data setup in Mixpanel, but even a rough correlation is a stronger investment signal than usage alone.
Cost per completed task
Different from API cost per query, a distinction that matters for multi-step agents, where a single task might involve dozens of model calls. Token cost per request is a finance metric; cost per completed task is a product metric. It tells you whether the unit economics of the AI feature make sense as you scale.
Human escalation/handoff rate
Too high, and the agent isn’t handling its scope. Too low, and it may be overconfident. The right number depends on the use case, but tracking the trend probably matters more than the absolute value.
API cost per request
The most granular cost metric: what does a single model call cost? This matters most during development and testing, when engineers need to understand the cost structure of different prompt architectures and model configurations before they’re solidified at scale.
API cost per user
Cost per request tells you the unit economics of a single call. Cost per user tells you the real cost of serving each customer with an AI feature. If your AI feature’s cost per user exceeds what that user generates in revenue, the unit economics of the feature don’t work, regardless of how good the model is.
Total API cost per day
The 10,000-foot view of AI infrastructure cost. Teams that only track per-request or per-user costs risk missing the total exposure until the bill arrives. Daily cost tracking surfaces unexpected usage spikes before they compound.
Return on AI Investment
The primary metric leadership will ask for once AI spend starts to scale, calculated as (Gain - Cost) / Cost) × 100. The cost side is relatively straightforward; the 'gain' needs to be defined at the product level: revenue impact, cost savings, or productivity gains.
Mixpanel Metric Trees connect AI usage KPIs directly to north star metrics; cost data can be imported via warehouse connectors for a full ROI calculation.
Where to start with AI product metrics
Two distinct audiences come to this problem from different directions.
AI-native teams, where the AI is the product, tend to start with model quality: accuracy, hallucination rate, and LLM-as-judge scoring. They’re often already using Langfuse or similar observability platforms for these signals, and what they need is the connection between model quality and business outcomes.
Traditional product teams adding AI features tend to start with adoption: are users finding this? Are they using it more than once? They often have a strong retention infrastructure already and need to extend it to cover AI-specific behavior.
The metrics are the same for both, but the priority order for establishing metric tracking is different.
Mixpanel is built for the layer where model observability and product behavior meet, where what the model does translates into what users do, and what users do translates into whether the business grows.
Learn more by checking out Mixpanel’s AI KPI template or contact us here.