

2026 B2B benchmarks: Depth, durability, and the new performance gap

B2B software is scaling, but scale alone isn’t the story.
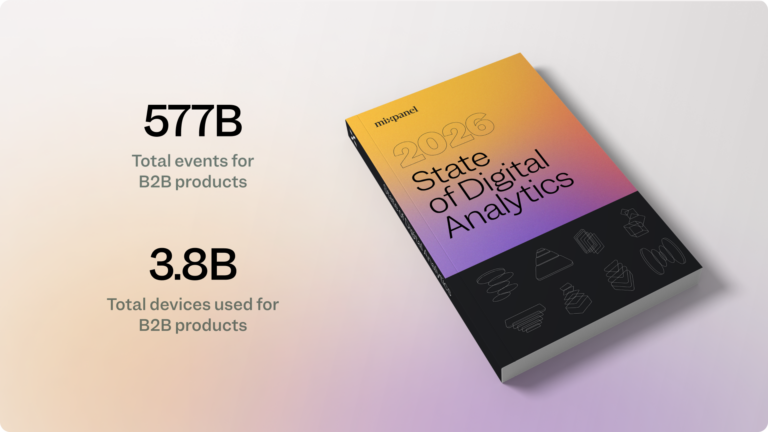
In the B2B segment of our 2026 State of Digital Analytics report, we analyzed 577 billion events across 3.8 billion devices, representing 27% and 11% year-over-year growth, respectively. Those numbers prove that growth is healthy across the category, yet the more important signal is beneath the aggregate numbers.
The data shows a structural shift in how B2B products compete. Advantage is accruing to companies that embed deeply into workflows, compress time to meaningful value, and convert usage into durable habit. Those that can’t are seeing weaker engagement and retention, even in large, established markets.
Here are the patterns that matter and what they signal for product, growth, and data leaders.
B2B benchmarks: A diagnostic, not a scorecard
B2B benchmarks aren’t just reference metrics. They’re diagnostic signals.
The 2026 report show how companies operationalize product-led growth, embed into account workflows, and compound value across teams. Acquisition reflects friction and packaging strategy. Engagement captures workflow depth. Stickiness signals habit formation. Retention surfaces integration velocity.
When you benchmark against the industry, the goal isn’t to match an average. Of course you'd prefer to exceed the average, but in the process identify which structural levers are driving durable advantage in your business.
Acquisition: Growth is concentrated, product-led motion is compounding
Even though B2B device volume increased 11% year over year, total event growth is stark across regions:
- APAC acquisition spiked 67% YoY
- EMEA grew an impressive 32%
- North America saw steady improvement at 6%
- LATAM contracted 11%
This isn’t simply a story about macroeconomic conditions. It reflects differences in how products are packaged, deployed, and experienced. High-growth regions show stronger alignment between product-led entry points, automation, and expansion mechanics. Lower-growth regions reveal friction at the intersection of pricing, localization, and onboarding.
Key takeaway
Top-of-funnel performance increasingly reflects internal product design decisions.
Regions accelerating fastest tend to pair high-volume user conversion with AI-driven automation and tight feedback loops between usage data and onboarding flows. In contrast, since LATAM is the only region dropping, they may have misalignment between pricing models and localization issues to address.
For product and growth teams, this suggests acquisition is less about channel optimization and more about reducing structural friction inside the product experience.
➡️ Get complete B2B benchmarks and more details in the 2026 State of Digital Analytics report.
Engagement: Depth of use is the new competitive edge
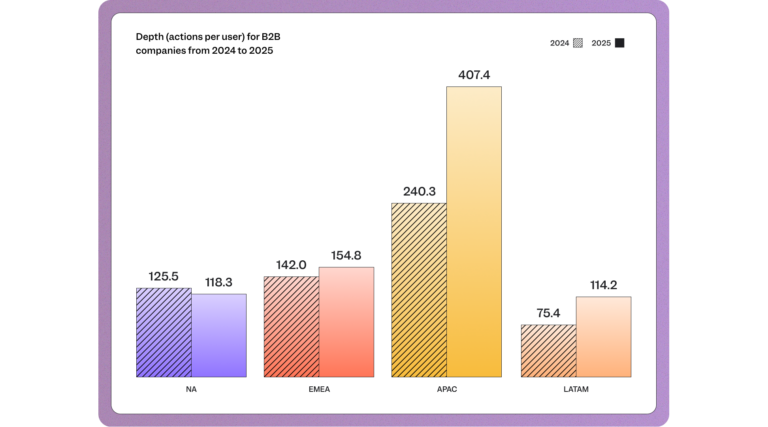
Acquisition is table stakes. Engagement depth is where competitive separation is emerging:
- APAC leads with 407.4 actions per user, up 70% YoY
- LATAM engagement rose 52%
- EMEA actions per user grew 9%
- North America declined 6%
High engagement per user often signals system-to-system automation, embedded workflows, and multi-role adoption inside accounts. Declining engagement, like in North America, may reflect consolidation pressure and increased scrutiny on redundant tooling.
Key takeaway
Raw active users tell only part of the story. Actions per user captures how embedded a product is in daily workflows.
B2B products that generate dense interaction patterns are harder to displace, often because they sit closer to execution. Products with shallow interaction depth are easier to rationalize away during renewal periods.
For engineering and product teams, this shifts the KPI conversation. Feature shipping velocity matters less than feature absorption velocity. The metric to watch is how frequently core workflows are repeated, automated, and shared across roles.
Stickiness: Habit formation is a design outcome
North America maintains the largest daily and weekly active user base, with 34.4M DAU and 110.7M WAU, both up 2% YoY. Even so, APAC leads in stickiness at 33%, which could indicate that B2B products are being used as recurring infrastructure, not episodic tools.
APAC’s leadership here aligns with strong engagement growth (+70% YoY), suggesting a reinforcing loop between automation, daily insight delivery, and developed habits.
Key takeaway
Establishing habits in the B2B space isn’t accidental. They’re engineered through recurring triggers, embedded workflows, and personalized outputs. Products that create daily check-in moments gain privileged position inside the account. Over time, these moments compound into switching costs that are more behavioral and emotional rather than contractual.
For product teams, the question shifts from “How do we increase feature adoption?” to “What daily behavior does our product anchor?” If there’s no clear answer, stickiness ceilings will likely follow.
➡️ Get complete B2B benchmarks and more details in the 2026 State of Digital Analytics report.
Retention: Early signals reveal structural strength
Retention data doesn’t sit in isolation as the report mirrors what we’ve already seen in acquisition velocity, engagement density, and stickiness:
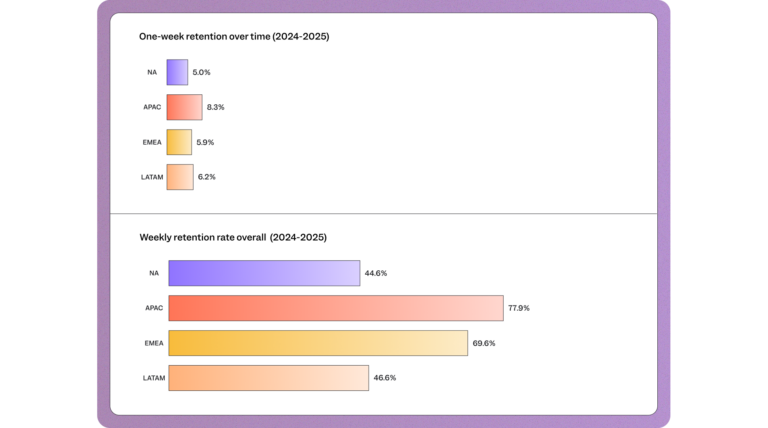
- APAC leads with an 8.3% one-week retention and 77.9% weekly retention
- North America records the lowest one-week retention (5.0%) and lowest weekly retention (44.6%)
- LATAM shows accelerating weekly retention despite slower initial week-one rates
Notice the alignment in that APAC leads in actions per user and stickiness also leads in both retention categories. Regions experiencing engagement softness (North America and EMEA) are also seeing weaker early retention. This proves that retention isn’t behaving randomly as it's consistent across the structural dynamics upstream.
Key takeaway
Retention data reflects organizational integration, not just product quality. Week-one retention captures more than initial delight as it reflects how quickly a product integrates into existing systems, processes, and incentives.
Where retention is strongest, we see tight alignment between initial use case and broader organizational workflow. Where retention lags, products may deliver value but struggle to integrate across stakeholders.
For data and growth teams in lagging regions, this reframes retention analysis. Instead of isolating drop-off cohorts, examine integration velocity: How fast does a new account connect multiple users, workflows, or data sources? Improving those and you may see an uptick in retention later.
In the end, accounts that achieve cross-role integration early tend to exhibit stronger long-term durability.
From benchmark to blueprint
B2B benchmarks are most useful if they change user behavior. The data in the report shows that growth alone doesn’t guarantee durability. Depth of usage, habit loops, and organizational integration separate resilient products from replaceable ones.
For teams using B2B benchmarks to guide strategy, the mandate is clear: instrument beyond surface metrics. Track feature-to-retention correlation. Measure time to repeat action. Quantify account-level stickiness. Build feedback loops that connect usage signals to expansion strategy.
To explore the full B2B benchmarks and regional breakdowns, read the complete B2B section of the 2026 State of Digital Analytics report.