


What is event analytics?

Event analytics is the process of tracking, analyzing, and deriving insights from behavior. It’s most commonly used in digital products, with the central data being user interactions ("events"). This kind of analytics helps with understanding user behavior patterns and identifying areas for product and process improvements to drive business impacts.
Times have changed. In the past, most digital analytics looked at data from a website-first perspective, focusing on metrics like sessions or page views. This was useful for aggregating data about your website (or product) but provided little insight into user experience.
Today, we’re more interested in understanding the user journey and seeing how users interact with our products, from their first interaction to purchase and beyond. Event analytics offered in solutions like Mixpanel makes it easier to track this progression and see below surface-level metrics to discover how users really interact with your product.
What is event analytics?
In digital analytics, an “event” is any interaction that a user has with your product, website, or mobile app. Every interaction triggers an event—a user opening your product, clicking on a button, and logging in all trigger events. But events aren’t only tied to actions taken by users. Receiving a message or notification would also count as an event, for example.
Events occur at specific points in time and are logged chronologically, making them particularly useful for understanding user flows.
Event analytics is the process of tracking, analyzing, and deriving insights from these events. It helps product, marketing, engineering, and other business teams understand user behavior patterns, identify areas for improvement, and make data-driven decisions that enhance user experience and drive business outcomes.
Why event analytics matters for product teams
Virtually anything that happens in a business can be captured as an event. Event analytics helps marketing, sales, and service teams track important revenue and growth metrics. But event analytics is especially useful for product teams who need a deep understanding of how users interact with a product to reach their KPIs.
Using event analytics can help with:
Getting beyond vanity metrics
Event data provides deeper insights than surface-level engagement metrics like page views, session duration, or purchases made. When taken together, events tell a story about your product. Activity and meaningful engagement aren’t the same, and using event analytics helps focus on what really matters.
Creating a complete picture of the user journey
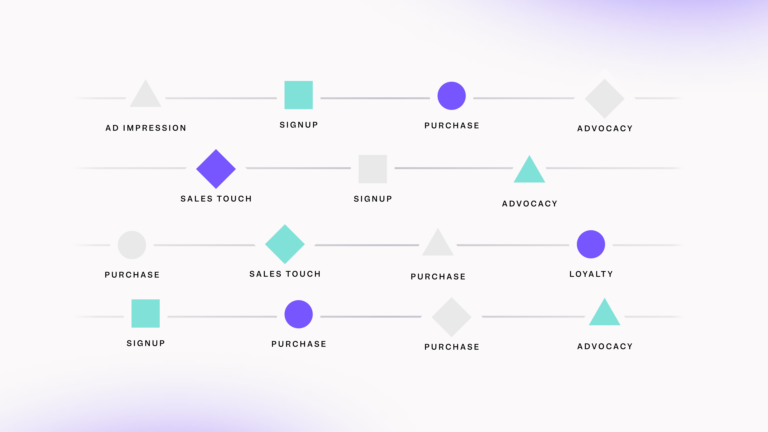
Event analytics allows you to track events sequentially, which makes it easier to connect disparate interactions into a cohesive user story. Events help you understand the context behind user behaviors and provide insight into where more qualitative research—like user interviews or session replays—might be helpful.
Driving product decisions with user behavior data
Event analytics shows you how users interact with your product and how that’s different from how you expect them to interact with your product. This helps you spot gaps in your flow or decide which features to prioritize. It also helps you validate or invalidate product hypotheses.:
The building blocks of event analytics
Here are some of the key components of a successful event analytics setup.
Tracking the right events to track
If you try to track every single event, you’ll quickly drown in a sea of unnecessary data. To avoid this “data pollution” from tracking everything, focus on business-critical data and create a tracking schema that makes sense for your goals and your organization.
The best analytics solutions make this easy by offering options to automatically capture the most impactful events for your digital product or website. In Mixpanel, it’s called Autocapture.
Clear even taxonomy
Clear and understandable event names make it much easier for everyone across the company to understand your reports. This typically looks like a consistent naming convention that avoids abbreviations or raw numeric IDs that won’t be clear to everyone. It’s important to balance granularity with maintainability.
You can use a data dictionary to build a central repository of your events and data definitions.
Adding context with event properties
Properties allow you to enhance event data with additional attributes that describe the event in more detail.
Properties can be event-specific or user-specific. For example, a purchase event might have properties like “items” (listing what was purchased) or “revenue” (how much the purchase was worth). A user-specific property could relate to demographics like age or geographic location, or behavioral data.
Event analytics models and frameworks
Event analytics frameworks help you determine which metrics to track and create a cohesive tracking plan. There are several popular event analytics frameworks:
AARRR: The pirate metrics framework
Dave McClure’s Startup Metrics for Pirates is a popular book and framework for tracking important metrics at every stage of a startup’s growth.
It focuses on metrics divided into stages:
- Acquisition: Where users are coming from
- Activation: When users start getting value from your product
- Retention: Keeping customers engaged over time
- Referral: When users start recommending your product
- Revenue: When your product generates income
Mapping events to each stage of the pirate framework will help you build a consistent and logical event-tracking schema.
Event-based North Star metrics
North Star metrics are the guiding light of your business—they ensure that your entire team is sailing in the same direction. One way to track a North Star metric is to create a composite from multiple events: For example, an ecommerce company might have a North Star metric of “the number of new customers purchasing each week,” with all teams working in tandem to improve that metric.
To contribute to that metric, you would combine several events, including “create account” and “purchase completed” within a specific timeframe.
User segmentation analysis
Another option for organizing your event tracking is grouping users based on event patterns, also called user segmentation. This helps you separate casual users from power users and will give you deeper insights into active usage and your DAU/MAU/WAU metrics (daily, monthly, and weekly active users).
Implementing event analytics: Best practices
Set your implementation up for success with these tips:
Plan your implementation
Create a tracking plan before implementing event analytics. Involve stakeholders from product, marketing, and engineering to build a schema that serves everyone's needs. Document your event taxonomy clearly and establish governance processes for adding new events.
Again, with options like Mixpanel’s Autocapture, your planning of what to track can be minimal to start. Adding manual tracking, often called precision tracking, later is always possible to do as your analytics needs grow.
Consider the technical aspects early
Depending on your tracking plan, you’ll typically need to choose between options like client-side and server-side event tracking. With Mixpanel, you can also ingest events from things like a customer data platform (CDP), Google’s Tag Manager, or a data warehouse. Beyond that, you’ll want to ensure data quality assurance processes are in place and make sure you’re keeping customer data safe and are compliant with data privacy and transfer regulations.
Governance and maintenance
Establish data governance and keep your documentation updated so that data is clean, accessible, and error-free.
How to derive actionable insights from event data
Collecting data for its own sake is interesting but not exactly useful from a business perspective. Your event analytics are only as valuable as the insights you can gather and the business decisions you make using that information.
Start by asking the right questions. You should begin with a hypothesis you want to test (related to a business problem you want to solve) rather than exploring data aimlessly. For instance, if user retention drops after day 7, analyze event data to discover what successful users do in their first week that retained users don't. This insight might lead you to highlight those key features for new users.
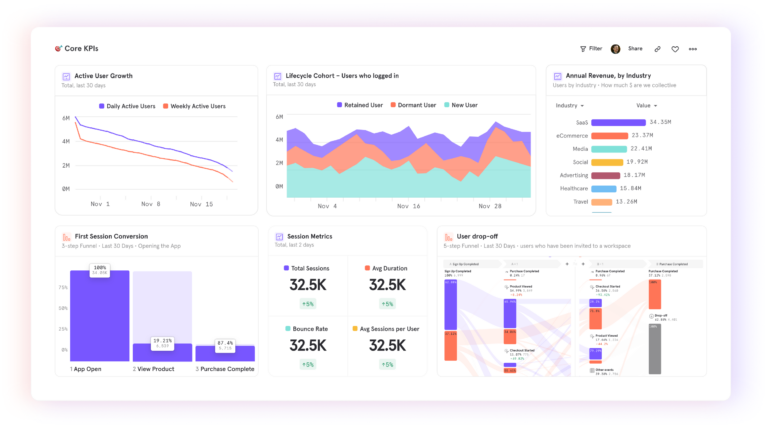
Use visualization tools and analysis techniques to dig deep into your data and translate your findings for the whole team. Event flows help you see frequent paths to or from any event. Funnels allow you to measure conversions through a series of events. Retention analysis helps you measure engagement over time. Reports and dashboards help you automatically translate this data into visualizations that everyone can read at a glance.
Once you have the event analytics set up to gather data, you can use those findings to guide product changes and updates to your roadmaps.
Finally, measure the impact of those changes with event data, and use those insights to build new hypotheses and guide new product changes.
“As we dug into the engagement analysis for the onboarding process for [our client’s new] dashboard aggregation tool, we found some pretty crazy links. The one that stood out the most was that users who added a minimum of three tools to their dashboard were much more likely to keep using the product long-term. It was a kind of magic number, and we shifted our onboarding experience to drive users to that goal. The activation metric became the correlated retention metric.”
FAQ
What's the difference between event analytics and traditional web analytics?
Traditional web analytics tend to focus on page views, time on page, and other visitor- or traffic-based metrics. Event analytics focus on interactions that users have with your product, app, or website. Event analytics have a more user-centric lens.
How many events should I track in my product?
This will depend on a variety of factors: The size of your company, the complexity of your product and user journeys, and the insights you are trying to surface. In general, less is more: In his video about building an event schema, Timo Dachau says that “50 events is already too many events,” for example. It’s important to think strategically about the information you need and what metrics you want to track and work backward from there.
Can event analytics work for mobile apps and websites equally well?
Yes, event analytics works for mobile apps and websites.
How do I ensure my event data is accurate?
Use a single source of truth for all of your data, like your data warehouse, and connect it to your event analytics tools.
Ready to start tracking? Explore Mixpanel’s capabilities for event analytics.