


2026 Finance benchmarks: The data and trends shaping digital finance this year

Fintech has crossed a structural threshold. Across banking, insurance, blockchain, wealth management, and alternative financing, digital products are judged less by growth narratives and more by measurable performance across the lifecycle.
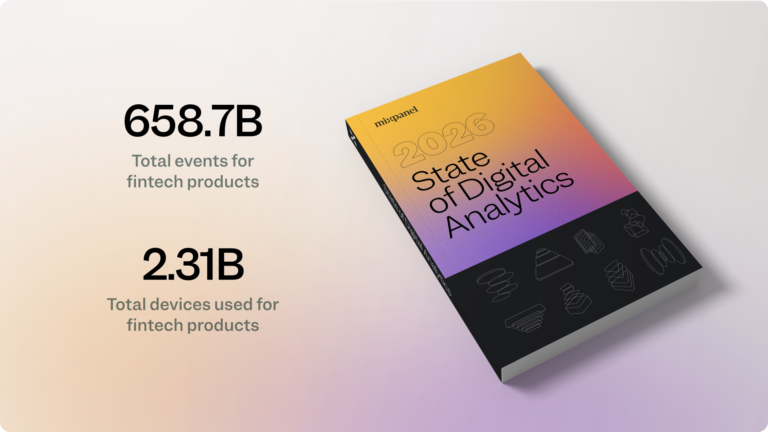
The 2026 State of Digital Analytics includes finance benchmarks that highlight this shift spanning 658.7 billion events and 2.31 billion devices across global fintech platforms.
Fintech’s volume tells one story. Behavior tells another.
At a global level, total fintech activity is massive and uneven:
- Wealth Management generated 362.6B events (+16% YoY), despite device count falling 23%
- Blockchain and Crypto produced 193.9B events, with devices up 5%
- Banking peaked at 27.7B events (+20% YoY) in events and +27% in total devices
- Alternative Financing saw modest event growth at 3% but device growth of 59%
For product and growth teams, that divergence matters. Some categories are expanding reach whereas others are consolidating. Wealth management’s event growth paired with declining devices suggests concentration among high-value users. Alternative financing’s device surge signals aggressive distribution and ecosystem integration.
At the end of the day, raw volume does not reveal maturity. Behavioral patterns do.
Acquisition: Regional acceleration defines the opportunity
Fintech’s growth efforts are shaped by infrastructure, regulation, and access gaps. The highest regional growth rates tell the story:
- Alternative financing in EMEA grew 638% YoY
- Banking in LATAM grew 88% YoY
- Insurance in LATAM grew 41% YoY
- Blockchain & Crypto in APAC grew 16% YoY
- Wealth Management declined across every region, with APAC down the least (-3% YoY)
LATAM stands out as a digital acceleration engine. Banking and insurance growth reflects onboarding of historically underbanked populations through mobile-first flows and embedded finance models. For growth and marketing teams, this signals opportunity in access-driven products, simplified KYC, and ecosystem partnerships.
Alternative financing’s spike in EMEA highlights a different dynamic. Embedded lending models integrated into ecommerce and SaaS ecosystems are compressing time to credit. Engineering teams building underwriting systems and real-time decisioning pipelines have a direct impact on acquisition velocity.
Since all regions within wealth management are contracting, this signals a pivot from mass-market volume toward efficiency and consolidation. Product teams may want to consider this as a lifecycle challenge rather than a top-of-funnel problem.
Key takeaway
Products in the fintech industry thrive when they align with regional needs and maturity levels. In emerging markets, success is defined by expanding foundational access. In more mature ecosystems, growth is increasingly driven by deep integration within established workflows. And for saturated segments, strategic optimization has officially replaced volume-based expansion as the primary goal.
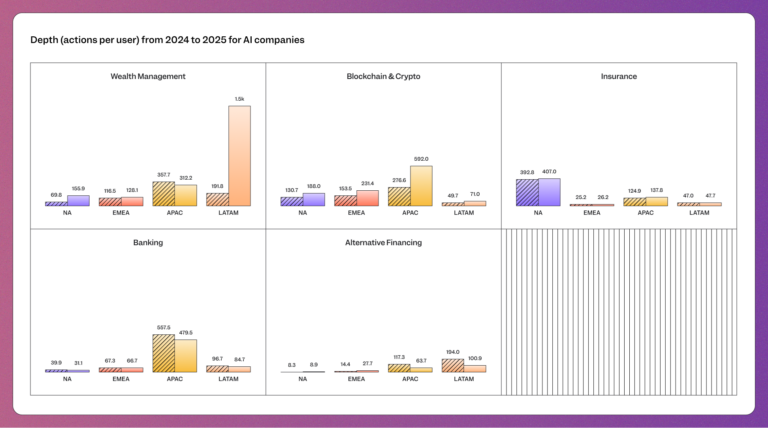
Engagement: Utility determines interaction depth
Growing users is one thing, but keeping them engaged in-product is the next challenge. The report highlights whether fintech products are becoming essential tools or remaining one-off apps people use once and forget about. The strongest actions per user winners are:
- Wealth management in LATAM, up 671% YoY
- Blockchain and crypto in APAC, up 114% YoY
- Alternative financing in EMEA, up 92% YoY
- Insurance in APAC, up 10% YoY
- Banking in EMEA declined 1% YoY
The surge in wealth management across LATAM reflects a rapid adoption of self-directed trading and mobile advisory tools that are empowering a new class of investors. For product teams, this isn't just a statistical spike; it’s proof that digitally native investors are moving toward higher behavioral sophistication and demanding more autonomy.
Similarly, APAC’s doubling engagement in blockchain and crypto suggests that practical utility (e.g., remittances and stablecoin usage) might now be the primary driver of activity. This shift means that for engineering and infrastructure teams, "invisible" features like performance, latency, and reliability have a direct, measurable influence on repeat behavior.
In EMEA, the engagement patterns for alternative financing indicate that borrowers are becoming more proactive in monitoring their credit health and repayment schedules. This behavior creates a strategic opening for teams to deploy dynamic dashboards and contextual nudges that turn transactional events into repeatable habits.
Meanwhile, declining banking engagement in EMEA shouldn't automatically be interpreted as a sign of weakness. Instead, it likely reflects a maturing market where routine transactions have become so automated that they require fewer deliberate interactions from the user. Ultimately, high engagement can be a "false positive" caused by poor localization or complex UIs; data teams must contextualize usage intensity to ensure they’re building for efficiency rather than accidental friction.
Key takeaway
Stop measuring how much users interact and start measuring why. Whether you need to lean into automation or double down on high-touch features depends entirely on the maturity of the region you’re serving.
➡️ Download the 2026 State of Digital Analytics for complete details.
Stickiness: Habit formation separates leaders from laggards
Stickiness, measured through DAU/MAU, reveals where fintech becomes embedded into daily life.
- Wealth management in LATAM reached 38%, up 41% YoY
- Banking in APAC reached 36%, up 13% YoY
- Alternative financing in LATAM reached 32%
- Blockchain and crypto in EMEA reached 32%
- Insurance in North America and LATAM reached 27%
LATAM’s strength in wealth management and alternative financing points to a deeper shift. In many markets across the region, fintech platforms have become essential tools for managing everyday financial life. Super app ecosystems and mobile-first access encourage repeat interaction, turning what once felt transactional into something habitual.
In APAC, banking’s 36% stickiness follows a similar thread because digital banking has woven itself into daily routines. Instant payments and embedded finance mean users move seamlessly from sending money to paying bills to shopping, all within the same environment. Banking functions less like a destination and more like a continuous layer inside broader digital activity.
Then there’s insurance in North America and LATAM with the lowest stickiness by far at 27%. Here, frequent engagement is still largely tied to renewals and claims, which limits how often customers return. This presents a significant opportunity for product and marketing teams to create smaller, more frequent moments of value that extend beyond major events.
Key takeaway
Decide whether your product is a daily companion or a transactional utility. Design experiences, alerts, and workflows that reinforce habit formation with measurable behavioral loops. Aim to shorten the distance between a user’s daily life and a financial action because even though growth spikes matter, repeated relevance matters more.
Retention: Early value determines durability
Retention signals whether fintech platforms convert growth into sustained participation.
Highest one-week retention rates include:
- Wealth management in LATAM at 13.4%
- Banking in LATAM at 10.6%
- Alternative financing in LATAM at 9.6%
- Blockchain and crypto in APAC at 8.6%
- Insurance in LATAM at 6.4%
Weekly retention leaders include:
- Blockchain and crypto in EMEA at 82%
- Wealth management in LATAM at 81%
- Banking in APAC at 79%
- Alternative financing in LATAM at 74%
- Insurance in LATAM at 63%
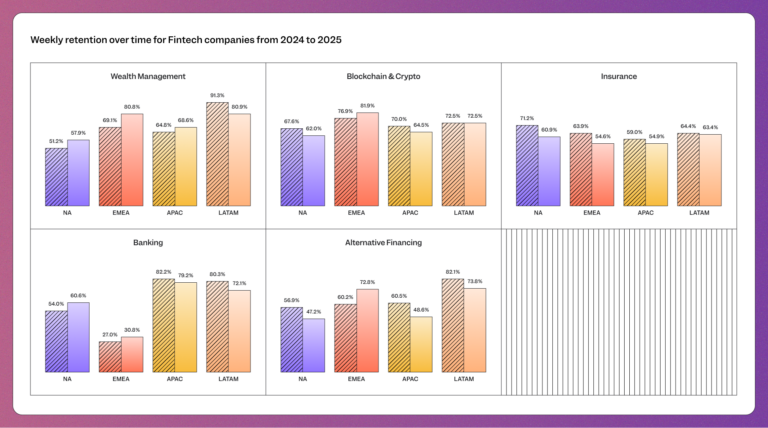
In alternative financing, one-week retention fell YoY in both LATAM and APAC, pointing to a cooling period after aggressive expansion. Tighter regulations, higher borrowing costs, and saturation in short-term lending are reshaping user behavior. Acquisition can spike quickly in this category, but early retention reveals whether those borrowers actually stick around.
Wealth management in LATAM shows a different kind of adjustment. Weekly retention declined from roughly 91% to 81% year over year. That isn’t collapse, but perhaps points to consolidation. After a surge in digital investing and mobile advisory adoption, users are settling into steadier patterns. The initial excitement phase has passed and what remains is a test of whether platforms can sustain long-term portfolio engagement.
Insurance in North America reflects a more structural challenge. Weekly retention also dropped 10 points from 71% to 61%, despite improvements in digital claims and underwriting flows. The problem in this region isn’t access; rather its relevance between major events like renewals or filing a claim. When users only return for these primary reasons, even well-designed digital tools struggle to create habitual behavior.
Key takeaway
Growth without early impact fades fast. Focus on compressing time to value, reinforce it with intelligent prompts and automation, and make your product relevant often enough to matter. Remember, retention isn’t a byproduct of features. It’s the result of delivering meaningful financial outcomes at the right moment and then repeating that value consistently.
The metrics that matter in fintech’s next phase
As fintech continues to mature, the metrics that matter evolve. Beyond acquisition counts, teams would be well-advised to track:
- KYC funnel completion and activation-to-funding rates
- First deposit or first transaction conversion
- Recurring portfolio review and balance check recurrence
- Borrower re-engagement windows and dormancy reactivation rates
- Portfolio activity and recurring investment retention
Metrics like these connect product behavior to business outcomes. They surface friction in onboarding, reveal borrower quality, identify churn triggers, and guide lifecycle experimentation.
Analytics functions as the control layer for fintech strategy. It separates temporary spikes from durable growth systems.
➡️ Download the 2026 State of Digital Analytics for more metrics and complete details.
Going forward, it’s all about measuring value
Fintech growth has accelerated across regions and subindustries, yet the patterns in the data show a clear shift. The advantage is moving toward teams that connect acquisition to activation, engagement to habit formation, and retention to recurring financial value.
For product teams, that means designing experiences that deliver immediate financial utility. For growth and marketing leaders, it means aligning regional strategy with real behavioral signals. For engineering, it means building resilient, real-time systems that support embedded finance at scale. For data teams, it means instrumenting the full lifecycle and identifying the precise moments where value compounds or friction drives churn.
The complete fintech benchmarks, including detailed breakdowns by region and subindustry, recommended metrics, and deeper analysis across acquisition, engagement, stickiness, and retention, are available in the full 2026 State of Digital Analytics report.
Download it here for access to the complete data and insights.