


Focus metrics vs. input metrics: Breaking down the components of a metric tree

You need data to make decisions. But tracking dozens of disjointed KPIs won't help, especially if you can't see how they connect to what actually matters. When it's unclear which metrics drive your business outcomes, which actions influence those metrics, and how they all fit together, you're essentially making decisions in the dark.
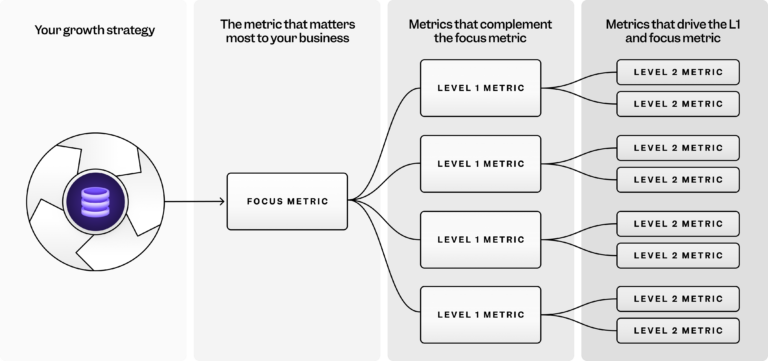
Metric Trees solve this by creating a clear hierarchy: a single focus metric at the top that represents your business goal, supported by input metrics below it that show you which actions actually move the needle. Here at Mixpanel, each team has visibility into exactly how their work ties to company-wide goals, thanks to metric trees.
To build an effective metric tree, you need to understand these two core components: your focus metric (the outcome you're chasing) and your input metrics (the drivers that get you there). Let's break down how they work together.
Defining your focus metric
A focus metric sits at the top of your metric tree. It’s a high-level measurement of overall business success and value creation. It reflects the outcome of operational efforts.
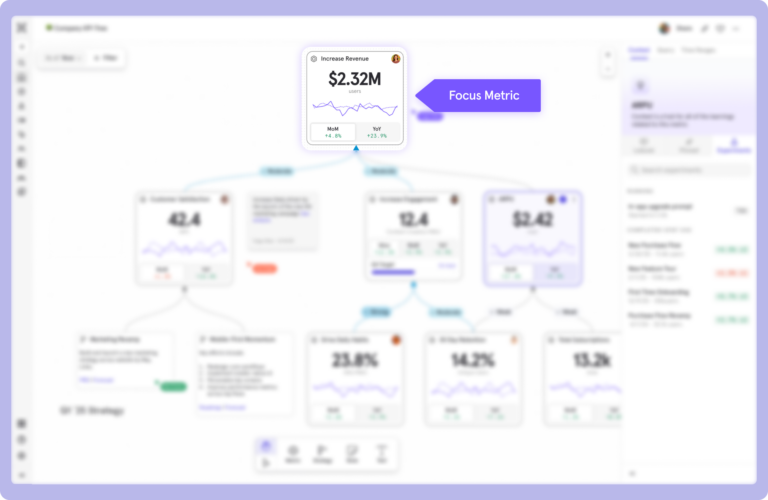
Since focus metrics are tied to overall business health, they’re often lagging indicators. Metrics like monthly recurring revenue (MRR) or 7-day retention rate are good examples of focus metrics.
Focus metric = Business/team value moment + Natural frequency
Example focus metrics
A good focus metric will directly influence the company’s goals and should be tied to both frequency and revenue. A high-level focus metric like MRR makes sense for a company generally striving to increase revenue. Focus metrics can also be specific to a company and industry:
- For a rideshare company, the focus metric might be the “number of rides per customer”
- An ecommerce retailer might use “weekly active buyers” as its focus metric
- An investing platform might choose “active investor count” for its main focus metric
Focus metrics are hard to influence directly. A rideshare company can’t simply decide to increase the number of rides each customer takes, and an ecommerce company doesn’t have direct control over how frequently buyers return to make a purchase. Focus metrics are a symptom of other activities and decisions. They show you that the changes you’re making lower on your metric tree (to your input metrics) are working (or not working).
How to determine a focus metric
Finding your focus metric is the first step to building a metric tree. It’s the “North Star” that’s tied to your most important business goals.
- Ask yourself: “What are the things my company (or, for smaller trees, my team) wants users to do?”
- The answers become a focus metric when transformed into usage-centric, time-bound measurements.
- As an example, for a SaaS company, a focus metric could be monthly active users/seats within each customer account.
Focus metrics are always important, and they should be tracked. But since they’re lagging indicators, they can’t guide tactical decisions or drive day-to-day input. That’s what input metrics are for (lower down the tree).
✅ Note: Conceptually, an input metric is any metric that’s controllable. Depending on the metric tree, some input metrics may be at "Level 3," some could be at "Level 4," etc.
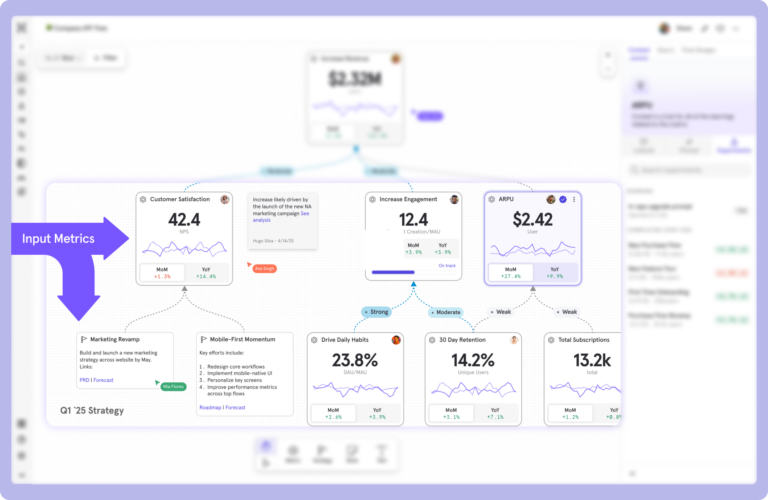
Understanding input metrics
Input metrics are the actionable and tactical metrics that, when combined, directly feed into and influence the focus metric. They measure the actions users take. Input metrics also link your daily tasks to your company’s overall strategy by impacting your focus metric.
Input metrics have different levels of importance:
- Level 1 input metrics are tied directly to the focus metric.
- The narrower, more granular metrics that impact your level 1 input metric would be further down your metric tree, at level 2, level 3, etc.
Example: Ecommerce company
The ecommerce retailer above using “weekly active buyers” as a focus metric might choose 7-day retention as a level 1 input metric. This helps them focus marketing spend on the users they’re more likely to retain. A level 2 input metric could be iOS app retention. If we wanted to drill down to a level 3 input metric, we could choose retention of a regional iOS app or a specific feature within the app. All of these input metrics ultimately lead to the top “weekly active buyers” focus metric.
Example: SaaS company
A level 2 input metric could be the usage rate on a new feature, while a level 1 metric might be a broader usage measurement of the suite of tools that feature belongs to.
Input metrics are leading indicators. They provide early warning that something is happening and predict a change in the focus metric. They’re often owned by specific teams (and for L2 or L3 metrics, can even be the responsibility of specific people).
A few examples of input metrics include:
- Conversion rate (Step 1 to Step 2 in a funnel)
- Page load time
- Feature adoption rate
- Email open rate
How to determine your input metrics
Ask yourself: “What are the driving factors for our focus metric that my specific team or function controls?” Each metric should be transformed into usage-centric, time-bound measurements. When one input metric informs another, it should be layered beneath it in a sub-level (i.e., a level 2 input metric drives a level 1 input metric).
The causal relationship between focus and input metrics
Both focus and input metrics are quantitative indicators essential for measuring product performance. All focus and input metrics exist in a hierarchy. They need to be defined clearly and consistently across the organization, with help from features like Saved Metrics and Lexicon.
In a metric tree, it’s this causal relationship that helps you see exactly where the failure points are when the focus metric goes down (ideally, before that even happens).
Using metric trees to close the strategy-execution gap
Knowing that your focus metrics are declining without understanding why is unhelpful. Metric trees close that gap by connecting your big picture strategy with tactical execution at the team level.
Metric trees help you ensure that you’re allocating resources in the right places to meet your goals: If you know exactly which initiatives and metrics will impact the bigger picture, you can prioritize the highest-leverage strategic initiatives.
Using focus and input metrics together also promotes team alignment and accountability: When the connection between a team’s work and a top-line outcome is vague, performance reviews default to subjective activity reports, shielding low-impact projects from scrutiny. With metric trees, each team owns the input metrics that fall under their purview, making their contribution to company-wide success clear.
💡 Learn more: How Metric Trees solve 4 common product manager problems
Tie focus and input metrics together with Metric Trees
Mixpanel Metric Trees helps you automatically build and visualize the complex hierarchy of focus and input metrics. With the right structures in place, you can transform abstract metric relationships into an interactive, real-time diagnostic assistant that makes data actionable and helps keep everyone aligned around common goals.
Turn strategy into action with Mixpanel Metric trees. Get started or book a demo today.