


Beyond dashboards and canvases: How Metric Trees do data differently

When people first hear about Metric Trees, we sometimes get questions like: “Why would I use this instead of a dashboard? Aren’t dashboards kind of Mixpanel’s thing?” Or, “so this is just a canvas like Figma?”
They’re fair questions, since Metric Trees are a relatively new concept (and nobody’s done them quite like Mixpanel). But the reality is that Metric Trees don’t do what dashboards do, and while they’re built on a canvas interface, they can do much more than a generalist tool like Figma or Miro.
Both dashboards and canvases are great—but they solve fundamentally different problems. Dashboards show you what happened. Canvases can capture relationships.
Metric Trees are an entirely new way to learn from your data, built around the idea of providing critical context and actionability at every layer of your strategy.
Dashboard limitations
Traditional business analytics dashboards are designed to monitor performance, not to map strategy or drive iterative action. They offer a snapshot of your most important metrics, but they lack the critical relational context needed for true decision-making.
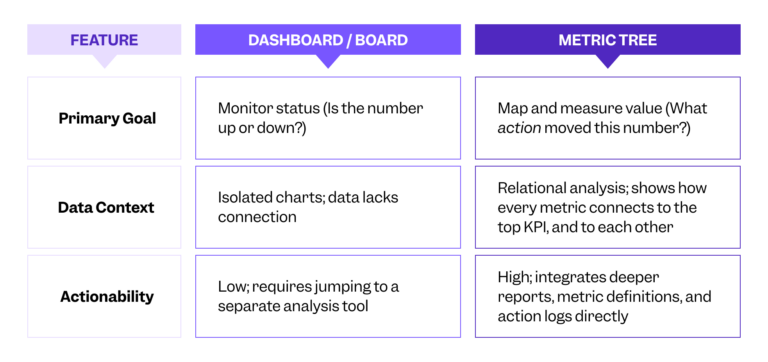
The board problem: they lack context and too narrow in scope
Boards tell you what is happening (e.g., revenue is down) but provide no inherent context as to why. They lack context of what’s important, how each metric connects, and relational analysis. They’re also inherently narrow in scope as their focus is set on one part of the business, not the whole growth model.
If a top-level metric dips, you’re forced to start a cumbersome, ad-hoc investigation, leaving you without a reliable way to map the cause-and-effect relationship back to your organizational strategy. Boards are a collection of answers without the connective questions.
💡Pro tip: Learn how to operationalize your growth strategy in our ebook, Beyond the North Star.
Canvas limitations
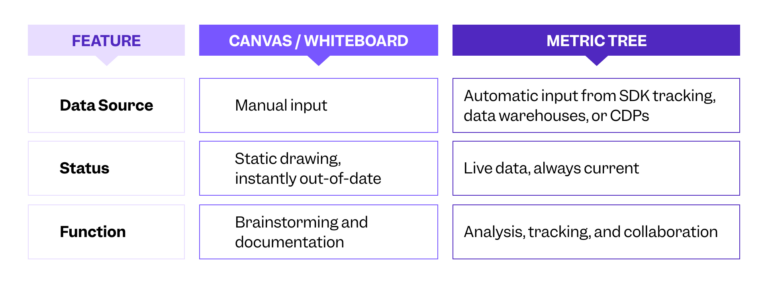
On the other end of the spectrum, many teams turn to visual whiteboarding tools like Miro or Figma to manually draw out their strategic frameworks (like a North Star framework or a “one metric that matters” (OMTM) tree. While these canvases are great for brainstorming and collaboration, they fall apart the moment they need to become operational.
The canvas problem: they’re static and lack real-time data
The core issues with creating a metric tree on a canvas is two-fold:
- Canvases aren’t live: The moment you draw a tree, the data is instantly out-of-date. The visual connections you map are decoupled from the real-time performance of the underlying metrics. It's a drawing of your strategy, not a living blueprint.
- Canvases aren’t actionable: There’s no ability to "double-click" into a deeper insight. You can't see the driver activity, compare performance over time, or assign ownership. The strategic map remains stuck in the ideation phase.
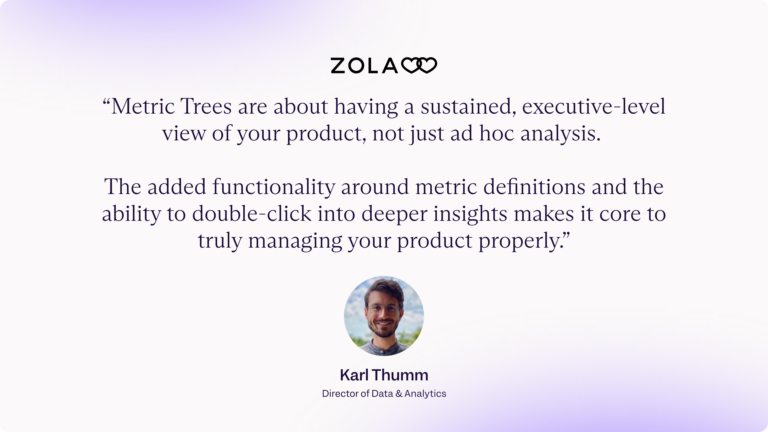
As Karl Thumm, Director of Data & Analytics at Zola, notes, the goal isn't ad hoc analysis—it's establishing a sustained view of value:
The unique power of Mixpanel Metric Trees
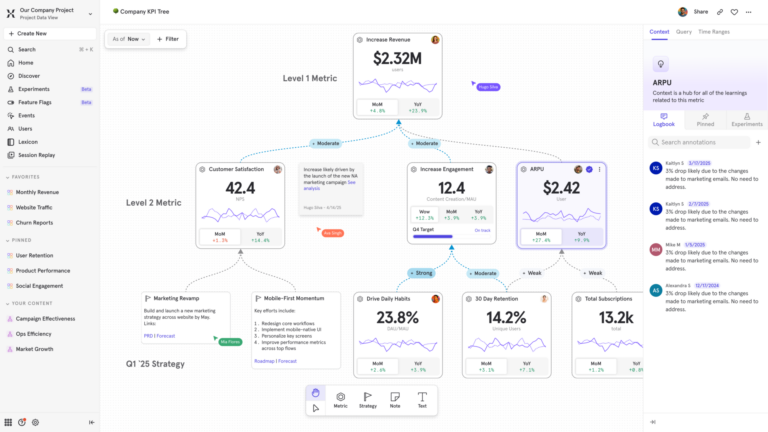
Metric Trees give teams the structure and shared context they need to interpret insights and make faster, clearer decisions together with confidence.
- Link effort to impact: Transform messy lists of metrics into structured trees, mapping every input to the outcomes that matter.
- Drill into what matters: Move fluidly from the big picture to specific metrics with real-time visibility and in-context analysis to pinpoint what’s driving change.
- Own, track, and evolve: Assign clear owners, set goals, run scenarios to plan targets for initiatives, and maintain a living history of changes so teams stay aligned and accountable.
Metric trees transform the abstract concept of a strategic framework into a live, collaborative engine for business growth. It’s a living actionable hub built within your analytics platform and tied directly to real-time behavioral data.
💡 Pro tip: See how you can operationalize your growth strategy with Mixpanel Metric Trees.
Clarity for leadership and executives
Leaders and executives gain instant clarity on which strategic bets are paying off and which are merely noise. By visualizing the impact hierarchy, they can prioritize initiatives with confidence, knowing the expected cascading effect on the top-line outcome. This enables them to set organizational direction and confidently allocate resources where they will drive the highest value.
Alignment for product managers and department leads
Metric trees solve the alignment challenge by providing a shared view of success and ownership. Leads can instantly connect their team's core behavioral KPIs (like feature adoption or campaign engagement) directly to high-level business goals. They can assign owners to each metric, reducing ambiguity and ensuring every team is moving in the same, strategic direction.
Context for cross-functional teams
Metric trees provide unparalleled context, enabling speed and autonomous decision-making across all teams. Every team member can see the relational analysis (the why behind fluctuations), real-time performance (the immediate impact of their work), and utilize the team hub (a centralized place for action logs and deeper reports). This shared source of truth allows product, marketing, engineering, and sales to move together from question to decision to action—fast.
Turn strategy into an engine for growth
By connecting behavior to outcomes and making that connection actionable, Mixpanel Metric Trees transform the messy middle into an engine for continuous innovation, fueling unstoppable momentum across your organization.
Mixpanel is the only solution that integrates this strategic framework directly into a powerful behavioral analytics platform. It provides a single source of truth that powers strategic clarity, autonomous alignment, and immediate context for all your data-driven decisions.Learn more about Mixpanel Metric Trees here or request a demo today.