

A list of metrics isn’t a strategy

Today is your product team’s weekly metrics review meeting. You have a mug of coffee in hand and several dashboards full of KPIs and metrics that you’ve been carefully tracking. You’re ready to go.
Except you quickly notice a problem. Activation has dropped suddenly since your last review.
Slack explodes with speculation about the cause. “Maybe the recent changes to our onboarding flow have added friction,” one designer says. “It’s probably a technical issue that’s impacting user experience,” theorizes a junior PM. “It’s the UI…” an engineer types into the chat.
But the truth is no one on the team knows. And without a clear metrics framework that shows you how metrics relate to each other, you won’t know what lever to pull to fix it, either.
Product teams track dozens of metrics and dashboards. When something moves, teams scramble to explain it. The issue is often a lack of structure rather than a lack of measurement. Tracking metrics is great, but metrics only become truly actionable when they’re organized into a framework.
You don’t have a metrics problem. You have a metrics architecture problem.
Creating lists of metrics creates an illusion of strategy
Dashboards and KPIs are useful, but they can also create visibility without prioritization. And as we saw in the example above, the team has to manually try to interpret what matters.
Let’s say your SaaS product team has a dashboard with a bunch of different reports, each showing progress on a different metric:
- Weekly active users
- Conversion rate
- Activation
- Retention
- Churn
- Feature adoption
- Session length
All of these metrics are arguably important to monitor, depending on your product and your business goals. But seeing them all laid out separately like this (even if it’s all in one dashboard) doesn’t tell you how they all affect each other. At best, it helps you spot when something looks off. If everything appears equally important, then nothing is.
To understand which metrics matter, you need to know how they interact: Metrics reveal their value through their relationships with each other.
How metrics become meaningful in relation to each other
Many companies use a North Star metric to define the single most important metric that predicts and influences a company’s long-term success. For example, Airbnb’s North Star metric is “total nights booked.” Amazon tracks “monthly purchases per user,” and Netflix goes by “watch time.” Each of these metrics makes sense for business goals.
A North Star metric is the guiding light that your company aligns behind. It’s the top focus metric that tells you what you’re optimizing for, and it will show you whether the efforts you’re making are successful. If the North Star number goes up or down, that gives you valuable information about the overall health of your strategy.
To use that information, you need to understand which metrics directly impact the North Star. And then, you need to know which metrics impact those metrics, from the smallest action (like a single email campaign) all the way to the top (your North Star).
Take the Airbnb North Star we mentioned above, “total nights booked.” The metrics that impact that number would be things like:
- Active listings
- Booking conversion rate
- Searches per visitor
- Average nights per booking
But to get the full picture, you wouldn’t stop at those metrics. You would look at the numbers that impact these metrics, like the number of guests clicking on the “stay” tab or the number of new hosts joining, as well as conversion and retention rates. It’s the impact all of these metrics have on each other that helps you see the full picture.
In other words, you need a framework that shows how all of the metrics you’re tracking relate to each other and to your ultimate goal. And the easiest way to map out that framework is a metric tree.
The metric tree framework: From measurement to strategy
Moving from a list of metrics to a metric tree framework enables a team to move from reactive analytics to proactive strategy.
Metric trees map out the hierarchy that connects outcomes to the actions that drive them:
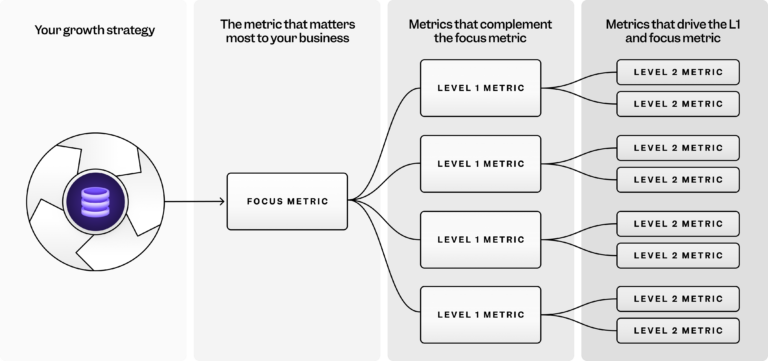
Unlike a list of metrics, this hierarchy gives every team member a clear line of sight from their daily work to the company’s top-level outcome. Each person can see how their work impacts outcomes, which metrics they influence, and what they are responsible for.
Teams that use metric trees diagnose problems faster: When the focus metric drops, they know exactly which branch to investigate, rather than losing time reviewing 15 different metrics and hoping that something stands out.
Let’s look at an example.
Example: Diagnosing a drop with a metric tree
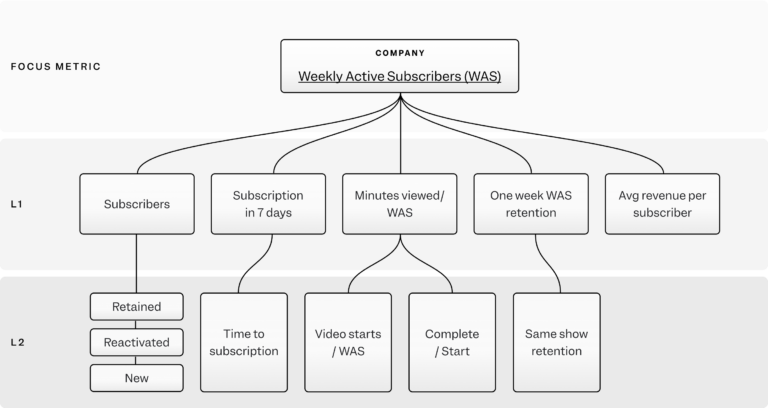
A streaming product team's focus metric is weekly active subscribers (WAS), subscribers who watch at least one video per week.
The L1 inputs are total subscribers, minutes viewed, and new subscribers in the last 7 days.
The L2 inputs are retained, reactivated, and new subscribers.
Imagine WAS drops and we need to quickly diagnose and fix the issue. Without a metric tree, there’s no easy way to understand where the problem is coming from. You have to look at metrics individually and hope you find the issue.
With a metric tree, that process is much more straightforward:
WAS drops 12%.
You look at your metric tree. Total subscribers is flat. Minutes viewed is flat. But new subscribers in the last seven days is down 30%.
You drill into L2: Retained subscribers are steady, reactivated subscribers are steady, but new subscriber acquisition has cratered. Now you know exactly where to look—and it took two minutes instead of two days.
Having this clear path reduces diagnosis time and allows you to move straight into figuring out how to fix it.
Structure turns metrics into action
In addition to making it easier to spot and diagnose problems, building a metric tree nudges teams to make a decision they’re sometimes tempted to avoid: What is the single most important thing to optimize for right now? That decision alone is worth the exercise because it clarifies goals, creates strategic alignment, and promotes accountability.
Most teams already track metrics. What they lack (and what metric trees provide) is the architecture that gives those metrics meaning.
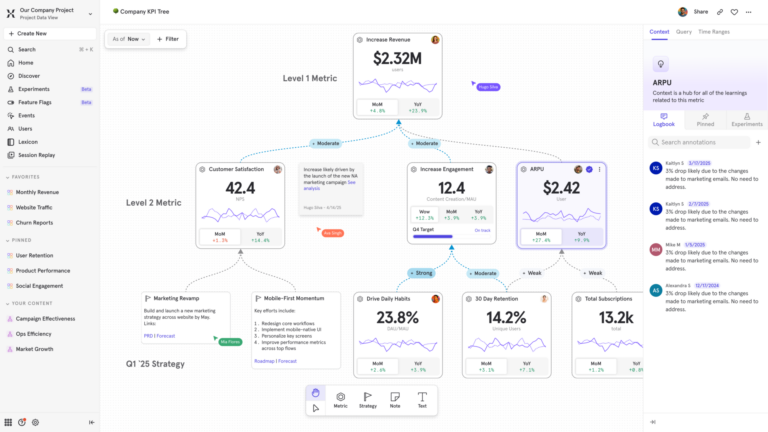
Mixpanel Metric Trees allow teams to build this structure directly inside their analytics environment, turning metrics from isolated numbers into a connected system that reveals cause and effect.