


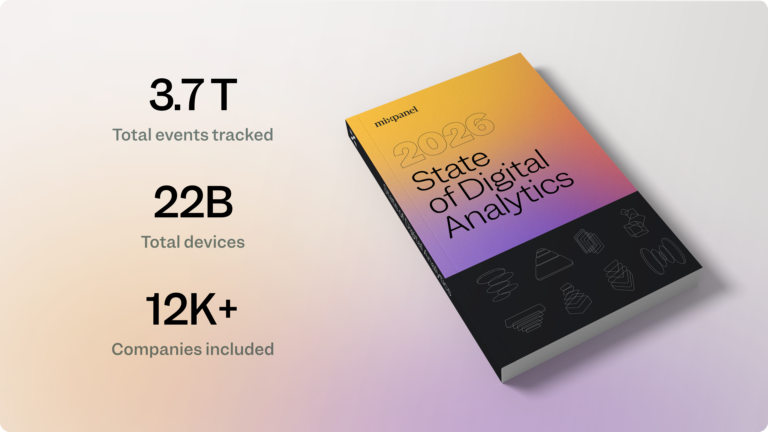
2026 State of Digital Analytics: Benchmarks, analysis, and recommendations

Digital analytics in 2026 looks nothing like it did even a few years ago.
AI has become the front door to data. Products are no longer static experiences. Customer behavior is more fragmented, more dynamic, and less predictable than ever. Analytics can’t just explain what happened. It has to help teams decide what to do next.
The 2026 State of Digital Analytics is built on that reality. Drawing on 22+ billion user actions across eight industries, four regions, and a full year of behavioral data, the report shows how modern digital products are actually growing today and where traditional measurement models are breaking down.
What’s inside the report
The 2026 State of Digital Analytics report goes deep across eight industries: AI, B2B, ecommerce, fintech, payments, media & entertainment, mobile gaming, and iGaming. Across each industry, performance is analyzed through four core lenses that define modern product growth:
- Acquisition: where high-quality users come from, how quickly they reach value, and which channels actually produce durable growth
- Engagement: how users interact with core features, how value is delivered per session, and where depth signals real product adoption
- Stickiness: how often users return, how habits form, and which behaviors anchor products into daily or weekly routines
- Retention: how early experiences predict long-term success, where users drop off, and which actions correlate with sustained value
The report pairs these lenses with regional comparisons and industry-specific recommendations so teams can understand not just how they compare, but why performance diverges and where to focus next.
What follows here is the connective tissue: the themes that cut through industries and regions.
Growth is no longer bought, it’s built
Across the data, one unifying signal stood out. Growth has moved decisively inside the product.
Channels still matter, but they’re no longer the primary growth engine. The strongest performers are winning by reducing time to value, embedding workflows, and making the product itself the most reliable path to acquisition, engagement, and retention.
This shows up differently by market maturity. In emerging regions, growth often comes from expansion and access. In mature markets, it comes from efficiency, doing more for users with fewer steps, fewer clicks, and less friction.
In both cases, the common denominator is product behavior. Growth is earned through experience, not spend.
Acquisition is slowing, activation isn’t
At the top of the funnel, the story is more nuanced than simple growth or decline.
In ecommerce, payments, and several consumer categories, acquisition volume in North America has flattened or pulled back. At the same time, LATAM is seeing significant expansion, often driven by mobile-first access and new digital infrastructure.
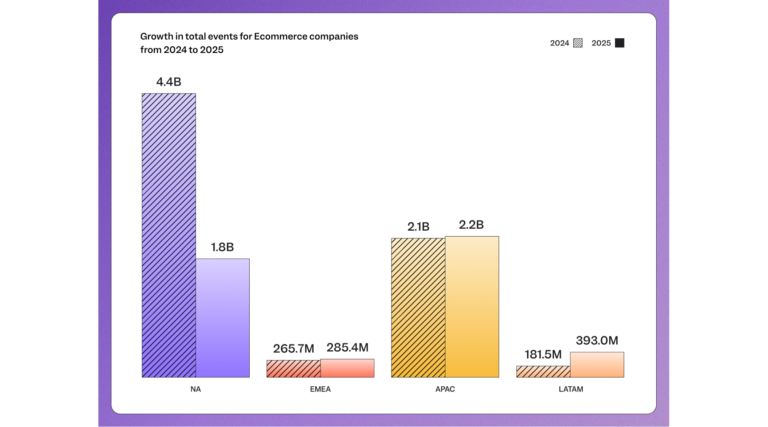
The takeaway is clear. Acquisition without activation no longer counts. The teams outperforming benchmarks are optimizing for qualified users who reach value quickly, not raw installs or signups.
➡️ Download the 2026 State of Digital Analytics for complete details.
Engagement rewards efficiency, not noise
Engagement data across industries is becoming increasingly polarized. In North America, for instance, AI products see fewer actions per user, which often correlates with higher task completion and faster outcomes.
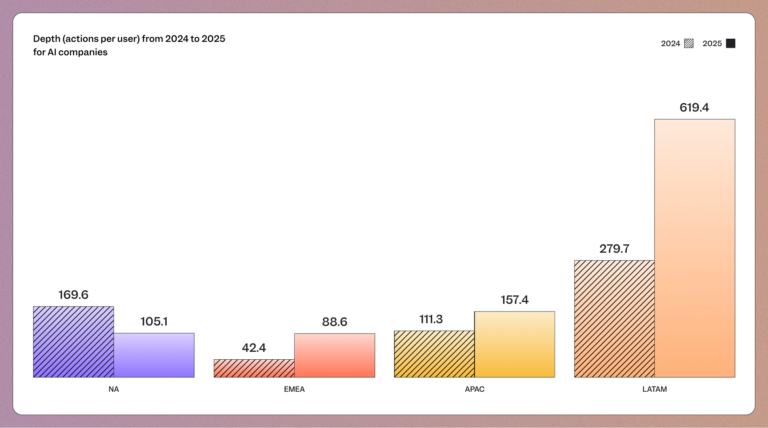
Meanwhile, AI and fintech products show that declining activity can signal success when automation replaces manual steps. Furthermore, media, mobile gaming, and iGaming see engagement spikes tied to live moments, mobile-first design, and real-time experiences, especially in emerging regions.
The implication is straightforward. Engagement isn’t about doing more. It’s about delivering value faster. Counting clicks or events without context misses the point. The metric that matters is value delivered per session.
Habit beats reach
Stickiness is where regional and product maturity differences become impossible to ignore.
Looking at fintech, payments, and media & entertainment, LATAM and APAC often lead in DAU to MAU ratios. Products in these regions are often embedded into everyday routines like payments, entertainment, or communication.
Stickiness is often lower in North America but paired with high efficiency. Users may log in less often because the product is doing more work in the background.
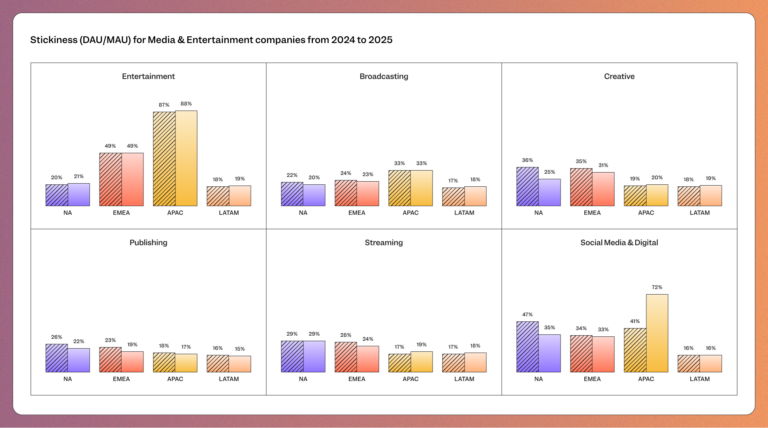
What this shows is simple. Habit is the real moat. Whether through daily touchpoints or invisible automation, the strongest products earn a regular place in users’ lives.
➡️ Download the 2026 State of Digital Analytics for complete details.
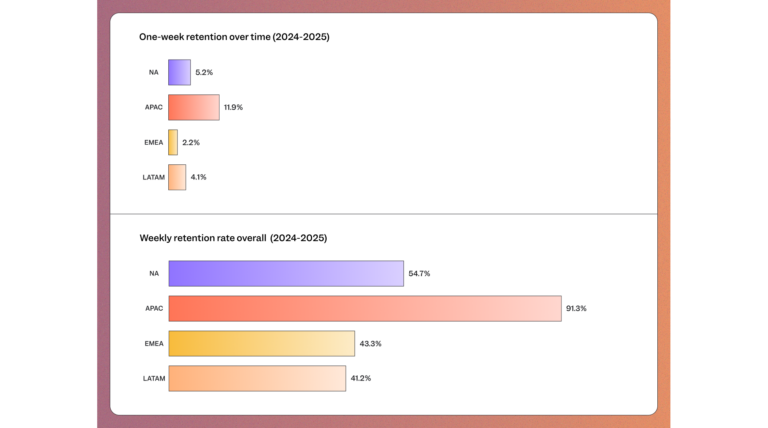
Retention is the growth metric that never lies
If there’s one metric that reliably predicts long-term success, it’s retention.
The data in ecommerce, payments, and mobile gaming sees early retention gaps are widening. Products that fail to deliver value quickly are losing users faster than they can replace them. Products that compress time to value see retention compound dramatically over time.
Retention isn’t something teams fix later with campaigns or reactivation flows. It’s designed, or lost, in the first experience. In a high-cost, high-competition environment, retention has become the most dependable growth lever available.
Analytics is becoming an active system
The biggest shift behind all of these trends is how analytics itself is being used. In 2026, analytics is no longer just a reporting layer. It’s an active system that helps teams:
- Predict what users will do next
- Identify friction before it causes churn
- Personalize experiences in real time
- Align product, growth, and marketing around shared outcomes
AI-assisted and autonomous analytics are accelerating this shift, moving teams from dashboards to decisions and from observation to orchestration.
Download the 2026 State of Digital Analytics
The complete 2026 State of Digital Analytics report delivers the benchmarks, insights, and recommendations teams need to build, measure, and scale better digital products.
Learn how top companies drive qualified acquisition, design for habit, and turn analytics into a competitive advantage. Download the full report and see where your product stands and where to focus next.