


KPI trees 101: Learn everything in this complete guide

Every day, product managers juggle dashboards full of metrics, user research notes, A/B test results, support tickets, sales feedback, and more.
All that information rarely tells a single coherent story, making it difficult to draw a clear, defensible line from the experiments you shipped to the outcomes the business cares about. The metrics aren’t the problem; they’re missing the connective tissue that links day-to-day product changes to measurable business impact.
A KPI tree provides that structure by helping teams map out user behavior and see how product decisions ladder up to business outcomes.
But just building a static structure isn’t enough; new features are constantly being launched, and user behavior evolves. This is where things can break down in practice, because a KPI tree without live data is just a dashboard or canvas that risks becoming disconnected from reality.
Keep reading to learn about what a KPI tree is, how to build one step by step, and how to operationalize it as part of a living product management ritual.
What is a KPI tree?
A KPI tree, also known as a metric tree, is a hierarchical model that links your North Star metric to the inputs that influence it.
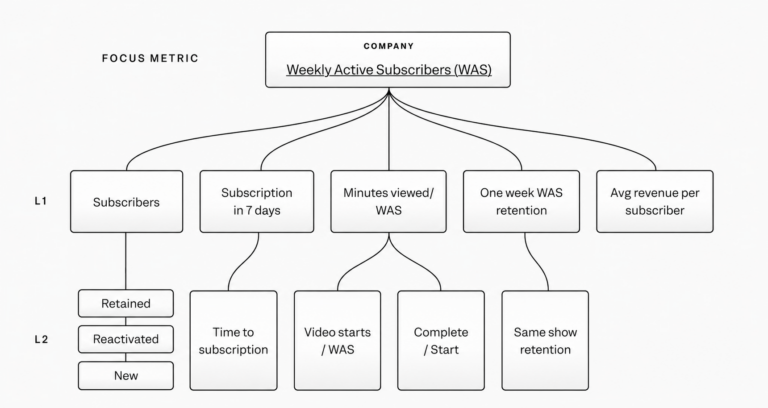
At the top, you have a single clearly defined goal such as revenue, retention, or a core usage metric. Beneath it, you break that goal into lower-level metrics that contribute to the North Star metric. For example, a subscription streaming service might define its North Star as weekly active subscribers, then break it down into drivers like subscribers, subscription in 7 days, minutes viewed, average revenue per subscriber, etc.
💡 Learn more: See how KPI trees solve 4 common PM problems.
Why KPI trees matter for product managers
Without a KPI tree, teams may optimize individual metrics without seeing how they affect the bigger picture. That makes it difficult to see whether gains are reinforcing each other or simply moving different parts of the product in different directions. If the users who complete onboarding don’t stick around, or increased feature usage doesn’t translate into paid conversions, revenue or retention may not change in a meaningful way.
Say your North Star is net revenue retention (NRR), and it starts slipping. Looking at the contributing or input metrics on your KPI tree helps you trace the change back to an increase in churn. From there, you might see that more accounts are canceling right after their first renewal period, which could point to poor onboarding or unresolved support issues.
That’s one of the biggest benefits of a KPI tree: instead of reacting to a vague “NRR is down,” you can focus your efforts on the exact stage(s) of the customer journey where the problem is.
The anatomy of a KPI tree
A KPI tree has three main layers. Let’s look at these from top to bottom:
1. North Star metric
This is the big “headline number” or primary outcome you want to drive, like Monthly Recurring Revenue (MRR) or weekly active paying users.
All the lower-level metrics in the KPI tree should ladder up to this metric.
2. Contributing metrics
These metrics form the structure of the tree and connect to the North Star through provable mathematical relationships. These are exact and provable. (e.g., An ecommerce retailer that uses “weekly active buyers” as a North Star metric might choose 7-day retention as a contributing metric.)
This layer answers a simple question: What directly impacts the North Star metric or outcome?
3. Behavioral inputs
At the bottom of the tree are the actions users take inside your product. This is the other type of relationship in a KPI tree. Unlike contributing metrics, these connections are based on hypotheses rather than strict calculations or formulas. Because of this, product teams need to test and validate these ideas over time.
For example:
- Users who complete onboarding are more likely to stay in the long term.
- Inviting teammates increases engagement.
- Using a key feature early leads to higher long-term usage.
Every KPI tree includes both kinds of relationships: mathematical relationships with contributing metrics, and hypothetical relationships with behavioral inputs.
How to build a KPI tree
You don’t need a perfect model at the start; focus on creating a clear structure and iterating on it as you go.
1. Define your North Star
Choose a metric that reflects long-term value, like WAPU (Weekly Active Paying Users) or the number of trial accounts with over three users in their first week. For many B2B SaaS products, this metric combines usage and monetization.
2. Break it down mathematically
Deconstruct the North Star into its core components and reverse engineer the factors that directly affect this metric. A well-structured KPI tree contains a few potential levels of contributing metrics:
- Level 1 (L1) metrics directly impact the North Star metric
- Level 2 (L2) metrics influence L1s
- Level 3 (L3) metrics contribute to L2s and offer even finer detail
3. Add behavioral hypotheses
Next, identify the user actions that may influence each contributing metric and need further validation. From a feature adoption perspective, you may want to test whether completing onboarding increases usage or if inviting teammates drives repeat usage.
4. Assign ownership
Each metric should have a clear owner, whether that’s a team or an individual.
5. Connect to live data
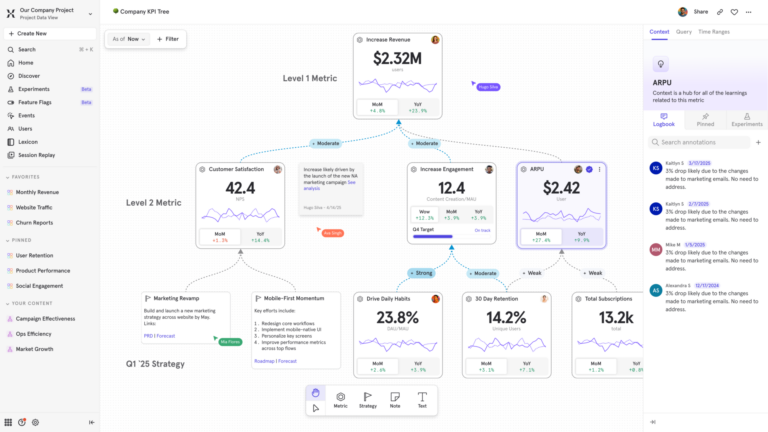
A truly effective KPI tree should connect to real data in your analytics platform. For example, Mixpanel has a native in-platform Metric Trees feature that connects each node to live data, allowing teams to monitor changes in near real time, spot unexpected shifts as they happen, and quickly drill down from high-level outcomes to the underlying metrics driving them.
6. Review quarterly
The first version of your KPI tree will most likely be incomplete. Review it regularly to validate assumptions, add, or remove unnecessary metrics. This will help you refine the structure and ensure it stays aligned with how your product works while reflecting changes in strategy or user behavior.
💡 Learn more about Mixpanel Metric Trees here.
A B2B SaaS example of a KPI tree
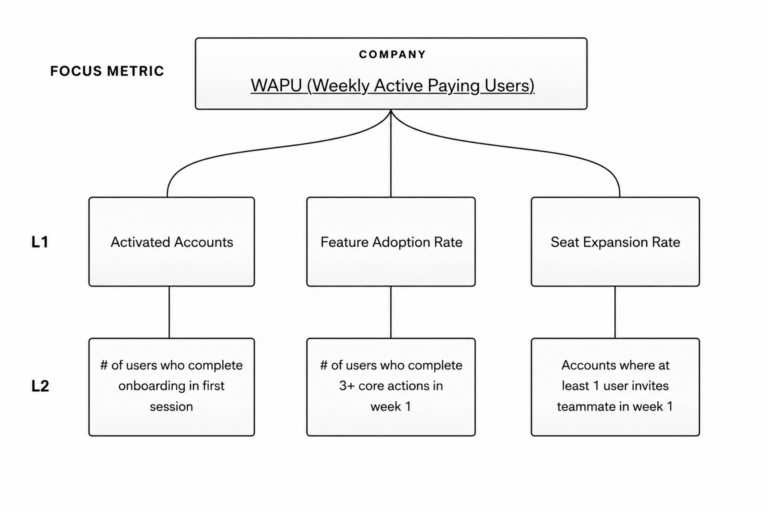
Consider a product manager working on a B2B SaaS product. Their North Star metric is WAPU (Weekly Active Paying Users).
Step 1: Structure the model using the North Star metric
This PM defines WAPU as:
Activated Accounts × Feature Adoption Rate × Seat Expansion Rate
Each of these three components is a key growth driver and represents a contributing metric.
Step 2: Add behavioral drivers
The product manager now adds behavioral inputs for each of the three contributing metrics.
Activated Accounts:
- Users who complete onboarding within their first session are more likely to become activated accounts.
Feature Adoption Rate:
- Users who complete three or more core actions in the first week retain at 2x the rate of those who don’t.
Seat Expansion Rate:
- Accounts where at least one user invites a teammate in the first week are more likely to expand their seat count.
Step 3: Define leaf-node metrics for each behavioral hypothesis
The team translates each behavioral hypothesis into specific, trackable events and metrics that sit at the bottom of the KPI tree. For example, instead of vaguely measuring “feature usage,” they measure whether users complete three core actions in their first week. To validate whether collaboration drives growth, they measure teammate invites sent per account in the first week.

The next step: From static document to live analytics
A KPI tree without live data is just a diagram. Static diagrams can’t reflect constantly changing experiments and features. Product teams are continuously shipping updates and responding to shifts in user behavior, which means the relationships between metrics can change just as quickly.
When a KPI tree is disconnected from this ongoing activity, it quickly becomes outdated and less useful for decision-making. The simplest way to ensure a KPI tree is accurate and valuable is to use an analytics platform with built-in metric tree capabilities that links nodes to real metrics and updates everything automatically.
AI-generated KPI trees
If you’re short on time or need a little extra support, there are ways of spinning up KPI trees quickly without building from scratch. Platforms like Mixpanel offer AI-generated KPI trees: just describe your business, product, or growth focus in plain language, and the platform will generate a structured first draft of a tree informed by industry best practices.

For example, you could enter an input saying you work at a B2B SaaS company that’s focused on increasing expansion revenue. Based on that context, Mixpanel’s AI Metric Trees generate a structured KPI tree that includes:
- Bets, or your strategic initiatives
- Input metrics, which measure the levers you can influence
- Your core outcome or North Star metric
- Output metrics that capture downstream impact
It even provides a short description for each node that gives additional context about its role in the model. That quickly gets you to a first draft that you can refine by adjusting relationships and adding the specific metrics that reflect how your business operates.
Go from scattered dashboards to a living map with KPI trees
For product teams, signals exist everywhere. But without a shared model, each metric tells a narrow story, making it difficult to see how those stories connect.
A KPI tree changes that. It turns disjointed numbers into a coherent system where every metric has a role, every driver has a reason to exist, and every product decision can be traced back to business impact.See how Mixpanel Metric Trees connect every metric to business impact, or generate your first-draft tree with AI in minutes.