

The 7 best Amplitude alternatives for product analytics

Amplitude is a major name in product analytics. But if you're reading this, you already know that. What you're likely trying to figure out is whether it's still the right fit for your team.
Because over time, you start to feel the trade-offs. The pricing scales faster than your product does. The interface takes longer to learn than it should.
And somewhere between onboarding and your third dashboard, you realize you're spending more time managing your analytics tool than actually using it.
This breakdown covers seven of the most-evaluated Amplitude alternatives—assessed on ease of use, depth of insights, pricing, and how well each one actually fits the way product teams work today.
Before diving in, it's worth understanding why teams are leaving Amplitude in the first place. The reasons matter, and they'll help identify which alternative actually fits your situation.
Why product teams are leaving Amplitude: Too complex or too expensive?
Amplitude has been a fixture in product analytics for years. It’s built for teams with dedicated data infrastructure, engineering support, and the bandwidth to invest in setup and ongoing maintenance.
Most product teams don’t have all three. And that gap between what Amplitude promises and what it realistically delivers is exactly where the frustration tends to build.
Here’s what users are saying:
- It’s hard to learn, and stays hard: Non-technical stakeholders and new team members routinely describe feeling overwhelmed. Getting to the point where someone can confidently build and run their own analyses takes significant training. And that investment doesn’t always pay off if people quietly stop using the tool.
- Advanced functionality requires more setup than expected: Custom analysis workflows often require careful setup and a solid understanding of how data is structured in the platform. Teams need to invest time upfront to define metrics correctly and maintain them as the product evolves. Without that discipline, these features can become underutilized or difficult to trust in day-to-day decision-making.
- Interoperability isn’t always seamless: While Amplitude integrates with other tools, connecting it cleanly into a broader data stack can take effort. Teams often need to coordinate across data pipelines, warehouses, and other systems to ensure consistency in how data is tracked and interpreted. This adds another layer of operational overhead, especially for teams that don’t have dedicated data resources.
- The pricing punishes growth: Amplitude’s pricing model is structured around event volume, but it escalates faster and more unexpectedly than many teams can manage.
7 best Amplitude alternatives product managers are switching to
1. Mixpanel
What is Mixpanel?
Mixpanel is a product analytics platform built around event-based behavioral tracking. It helps product teams understand exactly how users interact with their product.
For example, Mixpanel tracks specific actions users take, such as “Sign Up,” “Added Item to Cart,” or “Shared Dashboard.”
These events become the foundation for analyzing product engagement, feature adoption, retention, and conversion across the entire user lifecycle.
How Mixpanel works
Implementation typically begins with instrumenting events through Mixpanel’s SDKs or APIs. Teams can define meaningful events and properties (e.g., device type, plan tier, or location) and send them to Mixpanel in real time—or use autocapture to start collecting data immediately without upfront instrumentation.
Once events are flowing, Mixpanel automatically ties those actions to a user identity using its identity resolution system (ID Merge), which combines anonymous activity with known users when they sign in. This allows teams to follow a user journey from the first interaction through long-term product usage without losing context.
Mixpanel’s proprietary Arb database powers fast queries even on large datasets—so product managers can explore behavioral data without waiting on data engineering queues. Self-serve analysis is only practical when results come back quickly.
With data flowing, Mixpanel provides a suite of self-serve analysis tools—Funnels, Retention, Flows, and Insights—that enable teams to explore behavioral patterns, identify friction in product experiences, and measure the impact of new features.
Beyond the UI, Mixpanel AI adds an always-on intelligence layer. Mixpanel Agent monitors your key metrics continuously and surfaces what needs your attention—without waiting for you to ask. For engineering and AI-native teams, Mixpanel Headless exposes every Mixpanel capability as a typed Python SDK, so AI agents can query, analyze, and act on product data programmatically.
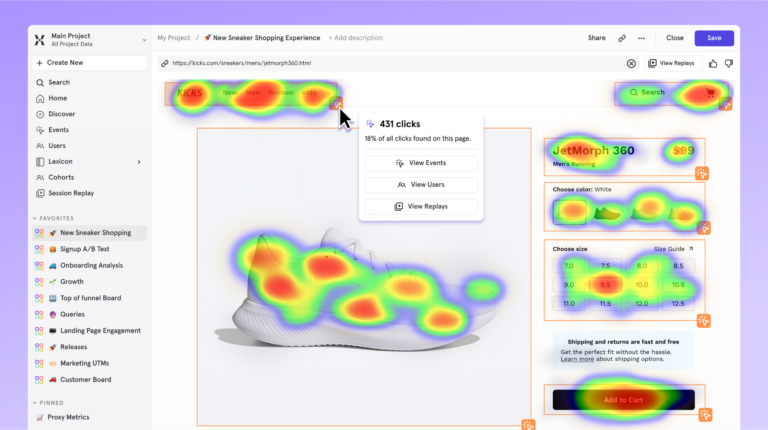
Session Replay with Heatmaps lets teams watch real user sessions to understand the behavior behind the data.
Key features
- Funnels: Analyze multi-step product journeys and identify exactly where users drop off between steps. Segment funnel performance by cohorts, device type, user properties, or time windows.
- Retention reports: Measure how often users return to the product after performing a key event. Mixpanel automatically groups users into cohorts and tracks engagement patterns over time.
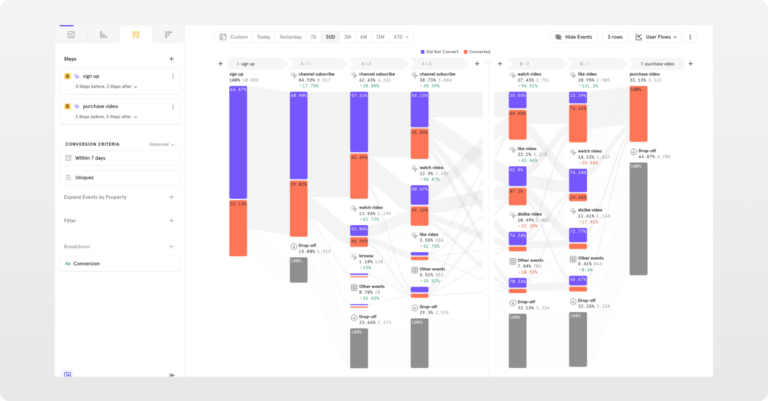
- Flows: Visualize the most common user paths between events. Helps product teams identify unexpected navigation patterns, friction points, or loops within the product experience.
- Insights: Build custom reports by analyzing trends, comparing segments, and visualizing behavioral data using event filters and breakdowns.
- Cohorts: Group users dynamically based on behaviors or attributes. Update them automatically as user behavior changes. Use them across reports or for targeting experiments.
- Experiments and feature flags: Run A/B tests and control feature rollouts natively, using shared cohorts and metrics to go from release to insight without switching tools.
- User profiles: Build a detailed timeline for each user, combining events, properties, and historical actions into a single profile.
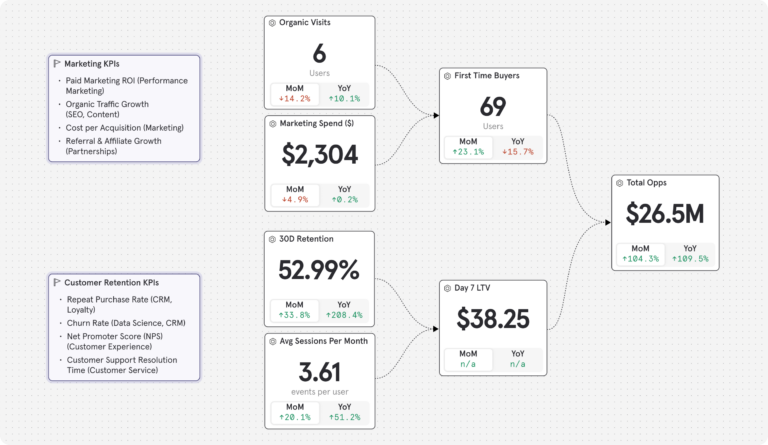
- Metric Trees: Build a live, hierarchical view that connects day-to-day product metrics to top-line business outcomes. Tie feature engagement to retention to revenue in a shared view—so every team can see how their work moves the number that actually matters. Amplitude has no equivalent.
- Mixpanel AI: An always-on product analyst that monitors your metrics continuously, surfaces anomalies before you ask, and runs root cause analysis in plain language. Ask it anything about your product—no SQL, no dashboard navigation required. Amplitude has no equivalent always-on intelligence layer.
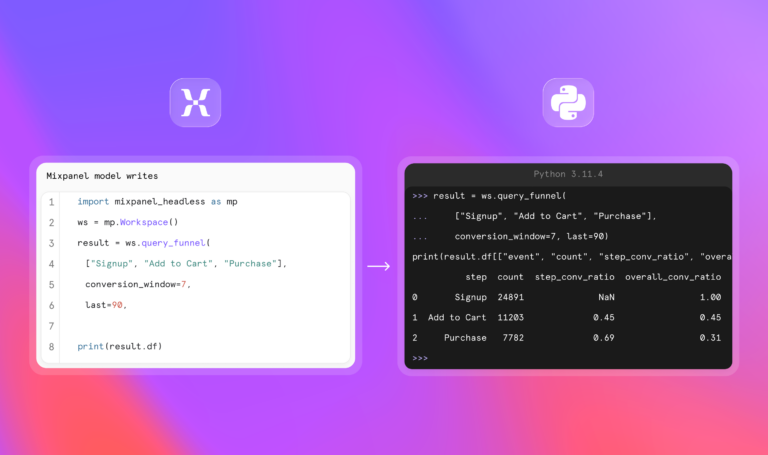
- Mixpanel Headless: A full Python SDK that gives AI coding agents direct programmatic access to every funnel, cohort, retention curve, dashboard, feature flag, and experiment in Mixpanel. Teams building AI-native products can automate analysis, trigger alerts, and drive product actions from code. Amplitude has no equivalent.
- Retroactive property updates: Update user properties after events have occurred without duplicating data or disrupting analysis—useful for teams whose event taxonomy evolves as the product grows.
- Borrowed properties: Enrich event data with user-level context at query time, without re-instrumenting anything.
- Group analytics: Analyze at the account or organization level rather than just individual users. Particularly useful for B2B products where engagement happens across teams within an account.
- Warehouse connectors: Integrate with data warehouses, including Snowflake, Redshift, BigQuery, Databricks, Google Cloud, Azure, and AWS S3. Supports mirror mode for bidirectional sync—a capability not available in Amplitude.
- Data governance: Automated governance, verified shared metrics, and fine-tuned access controls help enterprise teams trust every insight and maintain data quality as organizations scale.
How much does Mixpanel cost?
Mixpanel’s free tier has no time limit. It includes 1M monthly events, 10K monthly session replays, and up to 5 saved reports—enough for most teams to start getting real product insights on day one.
Paid plans:
- Growth: 1M monthly events included; $0.28 per 1K events after that (volume discounts available). Unlimited reports, 20K monthly session replays, cohorts, and more.
- Enterprise: Unlimited monthly events, advanced analytics, comprehensive data governance and security, and premium support.
Pricing scales with usage rather than punishing growth.
| If you’re a startup, pricing is even better Early-stage companies that were founded less than five years ago, have up to $8M in total funding, and haven’t redeemed any other offers can receive their first year free on the Startup Plan. Explore our Startup Program. |
How companies are using Mixpanel
Companies are using MIxpanel to understand which onboarding steps correlate with long-term retention and optimize accordingly—cutting time to value without changing the product.
I think Mixpanel is like a microscope of your customer experience. It allows you to see the entire picture from when a user first interacts with your brand all the way through to lifetime value and all the stages in between.”
They're also using Mixpanel to give product managers and growth teams self-serve access to behavioral data, reducing analyst bottlenecks and speeding up decision-making across the organization.
We use Mixpanel to monitor some of our main adoption and engagement metrics. So active users, retention. Also to monitor the funnels where our users are going through in their user journeys.”
Mixpanel customer reviews
We chose Mixpanel because it provides the purest form of analytics – clear, event-based insights without unnecessary complexity. It allows our teams to track exactly what matters, build funnels and retention cohorts with precision, and make decisions based on real user behaviour in real time.”
Mixpanel has made our teams more data-driven and aligned around a common view of the user journey. Quantitatively, it’s reduced back-and-forth with analysts and lets PMs and growth teams get many answers in a single working session instead of waiting for weekly reports.”
Mixpanel vs. Amplitude: How they stack up
| Feature | MIXPANEL | Amplitude |
|---|---|---|
| Event-based data model | ||
| Self-serve analysis | Moderate | |
| Funnels and behavioral analysis | ||
| Unlimited funnel steps | Limited | |
| Retention analysis | ||
| Session replay | ||
| Real-time analytics | ||
| Experiments and feature flags | ||
| Account-level analytics | ||
| Autocapture / instant setup | Limited | |
| Metric Trees | ||
| Retroactive property updates | ||
| Borrowed properties | ||
| Mirror mode for warehouse connectors | ||
| Data governance tools | ||
| AI & automation | ||
| Always-on AI agent | ||
| Context-aware AI (knows your metrics & events) | ||
| Programmatic SDK for AI coding agents (Headless) | ||
| Pricing & usability | ||
| Learning curve | Easier | Steeper |
| Pricing scalability | Gradual, event-based | MTU-based, steep curve |
| The verdict: Is Mixpanel right for your team? Mixpanel tends to be the better choice for product teams that want fast, self-serve behavioral analytics that deliver breadth and depth of insights without relying heavily on analysts or data engineers. If your team wants to accurately track user behavior, analyze conversion paths, and measure feature adoption without complex setup, Mixpanel typically offers a smoother experience. Teams that switch from Amplitude to Mixpanel are usually looking for simpler workflows, powerful analysis that's easier for non-technical stakeholders to access, and a faster path from instrumentation to insight. |
2. Heap (by Contentsquare)
What is Heap?
Heap’s defining characteristic is retroactive autocapture. It automatically tracks every user interaction on web and mobile properties without requiring developers to manually instrument specific events up front.
When the tracking snippet or SDK is installed, Heap captures clicks, taps, form submissions, page views, and element interactions automatically.
This means teams can define events and build analyses weeks or months after user actions occurred—and query historical data as if they’d been tracking those specific events from day one.
Key features
- Event visualizer: Define events directly from the interface by selecting elements within the product UI.
- Retroactive event definition: Define events after users have already performed them by selecting elements visually in Heap’s interface and applying that definition to historical data.
- Custom event properties: Enrich automatically captured events with additional context through JavaScript calls or server-side API.
- Data science features with Heap SQL: Direct SQL access to the complete event dataset, enabling custom analyses beyond Heap’s pre-built reports.
- Heap Illuminate: Use behavioral data to automatically identify patterns and highlight friction points within product journeys. Surfaces insights about drop-offs, errors, or unusual usage patterns.
Pricing overview
Heap offers four pricing options: Free (capped at 10K monthly sessions), Growth, Pro, and Premier. Contact sales for a quote on paid plans.
Heap vs. Amplitude: How they stack up
| Feature | Heap | Amplitude |
|---|---|---|
| Event-based analytics | ||
| Automatic event capture | Limited | |
| Manual instrumentation required | No | Yes |
| Behavioral funnels | ||
| Retention analysis | ||
| Session replay | ||
| Retroactive event definition | Limited | |
| Experiments and feature flags | ||
| Self-serve analytics | ||
| Learning curve | Moderate | Hard |
| Data governance |
Heap customer reviews
- “The auto capture feature is really useful. It automatically tracks all user interactions so I don’t have to manually set up event tracking for every single action.” Read the full review.
- “The web sessions and users are very different than what we see in Google Analytics. This can cause difficulties with determining the source of truth.” Read the full review.
| The verdict: Is Heap right for your team? Heap suits teams that haven't instrumented tracking yet and need behavioral data flowing quickly without an upfront engineering investment. The tradeoff: The retroactive capture that makes onboarding fast can make it harder to maintain a clean, intentional event taxonomy as the product grows, and depth of analysis tends to become a limiting factor over time. |
3. PostHog
What is PostHog?
PostHog is an open-source product analytics platform with a self-hosted deployment option. Teams can run PostHog on their own infrastructure or use the managed cloud service, giving complete control over where customer data lives and how it’s processed.
This deployment flexibility matters for organizations with strict data residency requirements or compliance constraints that prohibit sending behavioral data to third-party SaaS platforms.
The open-source model also means teams can inspect the codebase, customize functionality, contribute features, or fork the project entirely if their needs diverge from PostHog’s product direction.
Key features
- HogQL for custom queries: SQL-like query language for building custom analyses, calculating complex metrics, or exploring data patterns that PostHog’s pre-built reports don’t support.
- Experiments: A/B testing by measuring how different product variations affect user behavior, conversion, or engagement metrics.
- User surveys: In-product surveys that appear contextually based on user behavior, properties, or feature flag assignment.
- Feature flags: Gradually roll out new features, run controlled experiments, or toggle functionality without deploying new code.
- Paths: Visualize the most common sequences of events that users take before or after a specific action.
Pricing overview
- Free: Up to one project and one-year data retention.
- Pay-as-you-go: Usage-based option with up to six projects and seven-year data retention.
PostHog vs. Amplitude: How they stack up
| Feature | PostHog | Amplitude |
|---|---|---|
| Event-based analytics | ||
| Automatic event capture | Limited | |
| Behavioral funnels | ||
| Retention analysis | ||
| Session replay | ||
| Feature flags | ||
| A/B testing / experiments | ||
| Self-hosted deployment | ||
| Data governance |
Posthog customer reviews
- “The user recordings are super useful, allowing me to see what users do and click on, and helping me understand where they’re confused.” Read the full review.
- “The main downside is the learning curve. Because PostHog is very flexible and technical, it takes some time to properly design events, funnels, and dashboards.” Read full review.
| The verdict: Is PostHog right for your team? PostHog suits engineering-led teams that want analytics, experimentation, and feature flags in a single self-hosted environment—particularly where sending behavioral data to a third-party SaaS isn't an option. That breadth comes with tradeoffs: Maintaining your own infrastructure adds overhead, and product analytics depth is more limited than dedicated analytics platforms. |
4. Pendo
What is Pendo?
Pendo is a product experience platform where analytics serves as the foundation for in-app guidance, user onboarding, feature adoption campaigns, and product-led growth initiatives.
While Amplitude and Mixpanel focus on measuring what users do, Pendo focuses on influencing what users do next—through contextual messaging, walkthroughs, or tooltips triggered by behavioral data.
Key features
- Visual design studio: Define trackable features by clicking elements directly in the product interface through Pendo’s browser extension—creating analytics without writing code or deploying tracking changes.
- Product usage analytics: Tracks user interactions across the application and provides reports on which features are being used, how often, and by which user segments.
- Pendo Guides: Deliver in-app messages including tooltips, walkthroughs, announcements, and onboarding flows.
- Segmentation and targeting: Create user cohorts based on any combination of properties (role, account tier, signup date) and behaviors (features used, frequency, recency).
- Roadmaps: Share upcoming product plans with users and gather feedback on future features.
Pricing overview
Pendo offers four pricing plans: Free, Base, Core, and Ultimate. Exact pricing requires contacting sales.
Pendo vs. Amplitude: How they stack up
| Feature | Pendo | Amplitude |
|---|---|---|
| Event-based product analytics | ||
| Automatic event capture | UI tagging | Limited |
| Funnels and behavioral analysis | ||
| Retention analysis | Limited | |
| In-app messaging and onboarding | Limited | |
| Feature adoption analytics | ||
| Session replay | ||
| Experiments and feature flags | ||
| Product feedback tools | Limited | |
| Product roadmap sharing | ||
| Pricing model | MAU-based | MTU-based (event caps) |
Pendo customer reviews
- “The initial feature tagging in the app can be a bit finicky at times, especially if your application uses complex CSS selectors or includes dynamic elements.” Read the full review.
- “The in-app guides and feedback tools are especially helpful for improving adoption without extra effort.” Read the full review.
| The verdict: Is Pendo right for your team? Pendo makes sense when in-app guidance is the primary need — onboarding flows, tooltips, feature announcements — and analytics is secondary to the messaging layer. Teams that need serious behavioral analytics depth alongside in-app guidance typically find Pendo's analytics capabilities don't go far enough, particularly for complex products or large user bases. |
5. Fullstory
What is Fullstory?
Fullstory is a digital experience intelligence platform. It records actual user sessions—capturing every click, scroll, page transition, and UI interaction—so teams can see exactly what users experienced inside the product.
Key capabilities include rage click detection, error tracking, and frustration signals, which automatically surface sessions where users encountered problems. Fullstory is typically used as a UX research tool, either standalone or alongside a dedicated product analytics platform.
Key features
- Session replay: High-fidelity playback of user sessions, including dynamic content, CSS styling, JavaScript interactions, and form inputs (with PII masking).
- OmniSearch: “Search behavioral data using natural-language queries such as “users who rage clicked on checkout.”
- Data export: Behavioral data can be exported to external analytics or data warehouse platforms for deeper analysis.
- Conversion funnels: Funnel analysis showing drop-off rates at each step, with the ability to watch replays of users who abandoned at specific steps.
- User segmentation: Reusable user groups based on any combination of behaviors (clicked X, saw error Y, completed flow Z) or properties (device type, geography, user attributes).
Pricing overview
Fullstory offers three plans: Analytics, Workforce, and Anywhere. Pricing requires contacting sales. A free option is available for individuals and small teams (up to 30,000 monthly sessions and 12 months of data retention).
Fullstory vs. Amplitude: How they stack up
| Feature | Fullstory | Amplitude |
|---|---|---|
| Event-based analytics | Limited | |
| Session replay | ||
| Automatic interaction capture | Limited | |
| Behavioral funnels | ||
| Retention analysis | Limited | |
| UX friction detection | Limited | |
| Rage click / frustration detect | ||
| Experiments and feature flags | ||
| Product analytics depth | Moderate |
Fullstory customer reviews
- “Fullstory is an easy way to gather insights that we as a product design team would have no knowledge over.” Read the full review.
- “When it comes to their journeys section, you can’t just place a URL in to start a journey. You have to manually find the page and what it’s called.” Read the full review.
| The verdict: Is Fullstory right for your team? Fullstory fits teams running dedicated UX research workflows where session replay is the primary function—diagnosing reported issues, reproducing bugs, or watching behavior in specific flows. Teams that need session insights connected to broader behavioral analysis—funnels, retention, cohorts—may find Fullstory's standalone replay depth leaves a gap. |
6. Google Analytics 4 (GA4)
What is Google Analytics 4 (GA4)?
Google Analytics 4 (GA4) is Google’s modern analytics platform for measuring user behavior across websites and mobile applications using an event-based data model.
Unlike its predecessor, Universal Analytics—which relied heavily on pageviews and session-based tracking—GA4 structures analytics around events, allowing teams to capture more granular user interactions within a single reporting environment.
Key features
- Enhanced measurement: Track common user interactions, including page views, scrolls, outbound clicks, site searches, and video engagement.
- Explorations: Advanced analysis workspace where teams can build custom reports, segment user behavior, and analyze event data using visual exploration tools.
- Predictive metrics: Machine learning-generated insights, including purchase probability, churn probability, and predicted revenue based on historical behavior.
- DebugView: Real-time event stream showing data as it’s collected—useful for verifying tracking implementation and debugging issues.
- BigQuery integration: Direct export to BigQuery for deeper analysis, machine learning workflows, or custom reporting pipelines.
Pricing overview
Standard GA4 is free and includes tracking, analytics, and integration with the Google ecosystem. The enterprise version (Google Analytics 360) starts at approximately $50,000 per year, depending on scale.
GA4 vs. Amplitude: How they stack up
| Feature | GA4 | Amplitude |
|---|---|---|
| Event-based analytics | ||
| Behavioral funnels | ||
| Retention analysis | Limited | |
| Cohort analysis | Limited | |
| Session replay | ||
| Experiments and feature flags | Google Optimize discontinued | |
| Product analytics depth | Moderate | |
| Marketing attribution | Limited | |
| Cross-platform tracking | ||
| Data warehouse export | Via BigQuery |
GA4 customer reviews
- “Some commonly used reports are not as straightforward as before, and certain data comparisons require extra configuration.” Read the full review.
- “It helps me see where users come from, which content performs best, and where drop-offs happen, making it easier to optimize marketing efforts and improve the overall user experience.” Read the full review.
| The verdict: Is GA4 right for your team? GA4 fits content sites, ecommerce operations, and marketing-led organizations whose primary questions are about traffic, attribution, and advertising ROI. For product teams focused on feature adoption, behavioral retention, and user-level analysis, GA4 wasn't built for those questions and shows it. |
7. Adobe Analytics
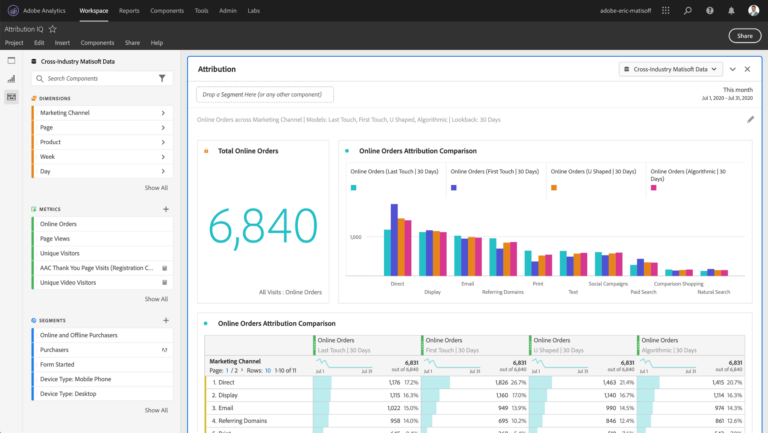
What is Adobe Analytics?
Adobe Analytics is an enterprise digital analytics platform built for large organizations that need to analyze customer behavior across websites, mobile apps, and digital channels at scale.
As part of the broader Adobe Experience Cloud, it focuses on connecting behavioral data with marketing, customer experience, and personalization workflows—with particular strength in omnichannel attribution and offline data integration.
Key features
- eVars (conversion variables): Capture contextual information tied to user interactions, such as campaign sources, product attributes, or user characteristics.
- Props (traffic variables): Track page-level or event-level traffic data to measure user interactions and navigation behavior.
- Fallout analysis: Examines where users exit multi-step processes, making it easier to diagnose friction within conversion flows.
- Customer Journey Analytics (CJA): Analyze customer behavior across multiple data sources, including web, mobile, and offline interactions.
- Calculated metrics: Custom formulas combining multiple metrics or dimensions for deeper analysis.
Pricing overview
Adobe Analytics does not publish pricing. Contact Adobe for a quote.
Adobe Analytics vs. Amplitude: How they stack up
| Feature | Adobe Analytics | Amplitude |
|---|---|---|
| Event-based analytics | ||
| Behavioral funnels | Fallout Analysis | |
| Retention analysis | Limited | |
| Cohort analysis | Limited | |
| Session replay | ||
| Experiments and feature flags | Adobe Target is separate | |
| Marketing attribution | Limited | |
| Enterprise data integration | ||
| Custom analytics flexibility | Very high | Moderate |
Adobe Analytics customer reviews
- “The platform is extremely powerful, but it can take time to become comfortable with all the features, especially for new users who are not familiar with its interface.” Read the full review.
- “Advanced segmentation helps me analyze specific audiences, while customizable dashboards make insights easy to visualize and share for faster, data-driven decisions.” Read the full review.
| The verdict: Is Adobe Analytics right for your team? Adobe Analytics suits large enterprises already operating within the Adobe Experience Cloud that need customizable attribution across marketing channels and offline touchpoints. Teams evaluating it as a product analytics tool are likely solving the wrong problem—the implementation complexity, cost, and marketing focus make it a narrow fit outside that ecosystem. |
Which tool fits your situation?
We want fast, powerful, and reliable product insights without a complicated setup → Mixpanel? Mixpanel is built for product teams that need to understand how users interact with the product and act on it quickly. Its event-based model covers funnels, retention, feature adoption, and cohort analysis in a reporting interface designed for product managers and growth teams—no analyst required. Mixpanel Agent monitors metrics continuously and surfaces what matters without being asked, and Mixpanel Headless lets AI coding agents drive analysis and product actions from code—capabilities that have no Amplitude equivalent.
We can't instrument tracking and need data immediately → Heap? Heap's retroactive autocapture is useful when engineering cycles are frozen and you need behavioral data before any instrumentation work begins. The tradeoff: once it's time to analyze, the depth of Heap's funnels, retention, and cohort tools is more limited. Choose Heap if retroactive event definition on historical data is the primary need. Choose Mixpanel if the goal is to act on what you learn—not just capture it.
Data sovereignty and privacy compliance are non-negotiable → PostHog? PostHog's self-hosted deployment gives engineering teams complete control over where behavioral data lives—a solid option when sending data to any third-party SaaS is not preferable due to privacy or sercurity concerns. For most enterprise teams, Mixpanel's EU data residency, SOC 2 Type II, GDPR compliance, and HIPAA support cover the requirements and give peace of mind without the overhead of a self-hosted stack.
We prioritize in-app guidance for user engagement → Pendo? Pendo is purpose-built for in-app messaging: tooltips, onboarding walkthroughs, and feature announcements triggered by behavioral data. The tradeoff is analytics depth—teams that need serious behavioral analysis alongside in-app guidance typically end up pairing Pendo with a dedicated analytics platform.
We want to watch how users actually experience the product → Fullstory? Fullstory's session replay and frustration detection are strong for dedicated UX research workflows. The gap: replay is observational rather than analytical. Choose Fullstory if session replay is a standalone research function. Choose Mixpanel if sessions should connect to funnel data, retention, and behavioral cohorts—so what you watch informs what you do next.
We want a free analytics platform integrated with marketing tools → GA4? GA4 covers marketing attribution and web traffic measurement well, and it's free. The gap shows up when product questions start mattering—feature adoption, behavioral retention, onboarding conversion. GA4's event model wasn't designed for those. Mixpanel's free tier (1M monthly events, 10K session replays, cohort analysis) is purpose-built for product analytics at no cost.
Our focus is omnichannel attribution across online and offline touchpoints → Adobe Analytics? Adobe Analytics is an enterprise marketing platform, not a product analytics tool—built for cross-channel attribution at scale within the Adobe Experience Cloud ecosystem. It belongs on this list only for organizations with enterprise marketing attribution needs and an existing Adobe investment. For product analytics, it's the wrong tool for the job.
| "If we just needed product analytics that actually works … it’s definitely Mixpanel in a heartbeat." Self-service design means product managers get answers themselves. Public pricing means you know costs upfront. It just works, which matters more than having every possible feature you’ll never use. Or like how Giyom Lebleu, Chief Product Officer at Step, puts it: "Mixpanel ... has become part of our process. During our review meetings, we look at the results, make decisions, and record them directly in the dashboard. The combination of reusing metrics, syncing back-end data, and sending experiment events to Mixpanel made it all work for us." Why teams go with Mixpanel. |
Switching to Mixpanel: What to expect in your first 30 days
Product teams switching from Amplitude often raise three concerns up front: Implementation time, data continuity, and whether a new platform will actually deliver clearer insights.
The experience is typically faster than expected, agrees Sandra Shen, Growth Director at Xmind:
Mixpanel allows us to see trends and get a complete picture of how users interact with our product. Most importantly, it gives us the ability to quickly compare metrics across different user cohorts.”
Most teams start by defining the events that matter most—signups, onboarding steps, feature usage. Once those events start flowing, Mixpanel turns them into funnels, retention reports, and behavioral insights that make it easier to see what’s actually happening inside the product.
Within a few weeks, teams usually notice they’re spending less time working around the analytics tool and more time learning from it. Product managers explore user journeys on their own. Growth teams test ideas faster. And decisions start coming from real behavioral signals.
Soyoon Park, Growth Manager at Kolon Mall, further confirms this:
Using Mixpanel, we were able to identify the exact points where users were dropping off in the purchase funnel. Mixpanel's funnel analysis helped us pinpoint the specific steps where users abandoned their carts.”
| See what Mixpanel can do for your team in the next 30 days. Talk to someone who’s helped teams migrate from Amplitude. |