


What is a metric tree? The complete guide with examples.

A metric tree is a logical hierarchy of your growth model. It maps out how each of your individual metrics influences the others, from low-level metrics like campaign performance or feature engagement up to your North Star metric, the focus metric that guides your business strategy.
For years, the North Star metric has served as a cornerstone for many product teams, providing a clear directional beacon for success. It excels at aligning efforts around a single, pivotal metric, connecting daily work to overarching business outcomes and driving sustainable growth.
By identifying a core metric that represents customer value and linking it to key input metrics, product managers gain a powerful lens through which to view their product’s health and trajectory. However, even with the North Star guiding the way, product teams often face challenges.
While a North Star framework helps set strategic direction, pointing to where you want to go (the North Star metric) and outlining the main paths (key inputs), it often leaves a crucial gap in operational execution. It provides the “what” and high-level “why,” but not always the granular “how.” That’s where metric trees come in.
What's a metric tree?
A metric tree is a logical hierarchy of your growth model. It maps out how each of your individual metrics influences the others, from low-level metrics like campaign performance or feature engagement (also called input metrics) up to your North Star metric, the focus metric that guides your business strategy.
The data community has been increasingly interested in the concept of detailed metrics hierarchies for organizational alignment, notably through discussions like Abhi Sivasailam’s influential talk at Data Council. The key idea proposed during that presentation is that product owners need better validation on how their decisions drive growth. A metrics tree creates clarity on how to get that validation.
A business is made up of small, measurable events, each of which has an impact on the whole–a marketing campaign, a feature release, a customer support ticket that’s resolved quickly, a customer that renews a yearly membership.
These smaller actions are often tracked as a metric on an individual or team level, rather than an organizational one. These input metrics indirectly impact overall business health and growth, but it can be hard to see how everything ties together when you’re only looking at a small piece of the whole.
On the flip side, North Star metrics (aka focus metrics) tell you more about overall performance and business health, but they’re often lagging indicators. Reporting on focus metrics gives you valuable insights into what happened—but without tying them to input metrics, it’s difficult to drill down into why it happened, or use that information to make decisions.
A metric tree makes it possible to see the entire picture. By combining focus metrics and input metrics and understanding the relationships between them, you can understand what’s happening to cause the changes being reported at the top.
💡Pro tip: See how you can operationalize your growth strategy with Mixpanel Metric Trees!
The North Star is your compass, the metric tree is your map
With the North Star framework, and the North Star metric at the top, the key inputs (L1/L2 metrics) are the main paths to get there. It’s a high-level guiding principle.
Think of a metric tree as your detailed map. Once you know where you're going, the map shows you all the streets, turns, and specific landmarks that make up those paths. By making these connections explicit, metric trees empower teams to not only understand what needs to be done, but how all the pieces fit together to drive that all-important North Star, transforming strategic intent into actionable, measurable execution.
Example: Revenue in X time period
For example, if your focus metric is “revenue in X time period,” a metric tree would break that down into its component parts: “Number of users” multiplied by “average revenue per user.” Increasing either the number of users or the average revenue per user (or ideally, both) would increase revenue. Metric trees make these connections clearer.
Why product teams need metric trees
Metric trees bridge the gap between strategy and execution in the current North Star framework. Metric trees allow each team member to understand how their actions impact the broader organizational goals—and when focus metrics change unexpectedly, it helps executives and leadership teams see which actions led to those changes, on a granular level. If revenue drops or churn increases, it’s important to understand why.
Revisiting the “revenue in X time period” example
Let’s go back to the “revenue in X time period” example focus metric from the previous section. If that number is trending down, is it because:
- The number of users is decreasing?
- The average revenue per user is decreasing, or both?
The answer to those questions will impact the next steps. Metric trees help you understand what’s happening faster, and that real-time decision-making transforms questions that once required lengthy meetings into insights available in minutes. With metric trees providing a structured framework, teams can quickly drill down from high-level KPIs to specific user behaviors, eliminating the delays that traditionally slow product development cycles
When you have a full view of how each decision will impact all related metrics (all the way up to your North Star), it removes the guesswork from choosing what to prioritize and what direction to go in. Metric trees also prevent optimizing one area at the expense of another, so you can make smarter tradeoffs. Marketing teams now see how their campaigns impact in-product decisions. Product teams understand how feature releases affect customer support tickets. Everything is tied together, and everyone is operating from the same playbook.
The components of a metric tree
Some companies build a single, all-encompassing metric tree for their entire organization. Others start smaller and create metric trees for individual teams. In either case, a metric tree can be broken down into a few essential elements:
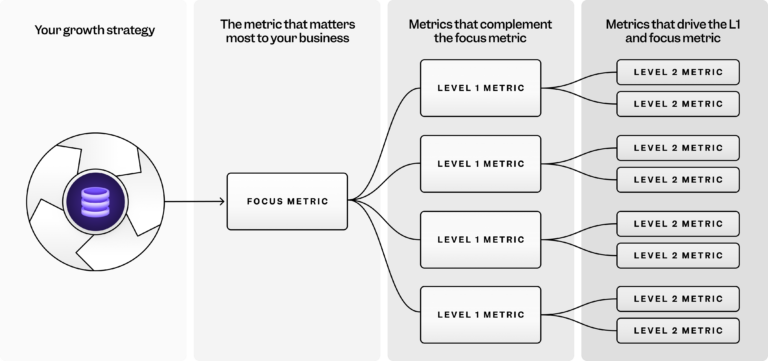
1. The North Star metric, or focus metric
Defining your focus metric is the first step to building an effective metric tree. Your focus metric sits at the top of your metrics tree and is the metric most linked to business outcomes. It’s usually related to numbers like revenue, growth, or user satisfaction.
To uncover your focus metric, ask yourself: "What are the things my company (or, for smaller trees, my team) wants users to do?"
The answers become a focus metric when transformed into usage-centric, time-bound measurements. For example, an ecommerce retailer might use “weekly active buyers” as its focus metric, as it’s tied to both frequency and revenue.
2. L1, L2, L3 Input metrics
Input metrics are the key to a strong metrics tree strategy. They tie your daily work and granular actions up to your focus metric.
- L1 input metrics impact the focus metric.
- L2 metrics feed into the L1 metrics.
- L3 metrics (not pictured here), would ladder up to L2 metrics, and so on.
Every action taken that can be tied to a measurable output should have a metric measuring its success.
To help you uncover your input metrics, ask yourself: “What are the driving factors for our focus metric that my specific team or function controls?” You’ll probably come up with multiple answers. Each one should be transformed into usage-centric, time-bound measurements.
When one input metric informs another, it should be layered beneath it in a sub-level (i.e., a level 2 input metric drives a level 1 input metric). For an ecommerce company, a level 2 input metric could be new and existing active users, while an L1 metric might be three-month active users.

How metrics are connected
Metrics in a metric tree can have two kinds of relationships: component relationships or influence relationships.
In component relationships, the metrics have a direct and quantifiable impact on each other. Component relationships are constant. For example, “revenue in X time period” has a mathematical relationship with its component parts, “number of users” and “average revenue per user.” You can calculate how those numbers will change with a formula.
The second type of relationship is an influence relationship. These are metrics that are correlated but don’t have the same quantifiable connection. For example, speed-to-lead is often positively correlated with win rate. But no formula guarantees that increasing speed to lead by X will improve win rate by Y. There is a correlation, but no measurable causal relationship.
Avoiding vanity metrics
Vanity metrics look good on paper, but they don’t actually measure any tangible business outcomes. They often create a false sense of success and hide real issues.
To help you spot vanity metrics, look for:
- Lack of actionable insights: They don't tell you what to change.
- Quantity over quality: They prioritize volume over actual engagement.
- Hindrance to decision-making: They give an incomplete picture.
Example: A simple pageview metric may not measure valuable user behavior.
Turning data into action with metric trees
There are five key principles to enabling metric trees to work effectively.
1. Democratize your tree’s real-time data and metrics in a self-serve platform
Everyone should have access to the data they need without technical barriers. Use a self-serve analytics platform to democratize real-time access to data and make it easy for everyone to understand how their actions impact the overall metric tree. A product manager should have the data and resources to correlate user engagement with feature release dates, for example, and a marketing manager needs to be able to look at overall churn rates and drill down to campaign-specific performance, without jumping between tools or requesting help from the analytics team.
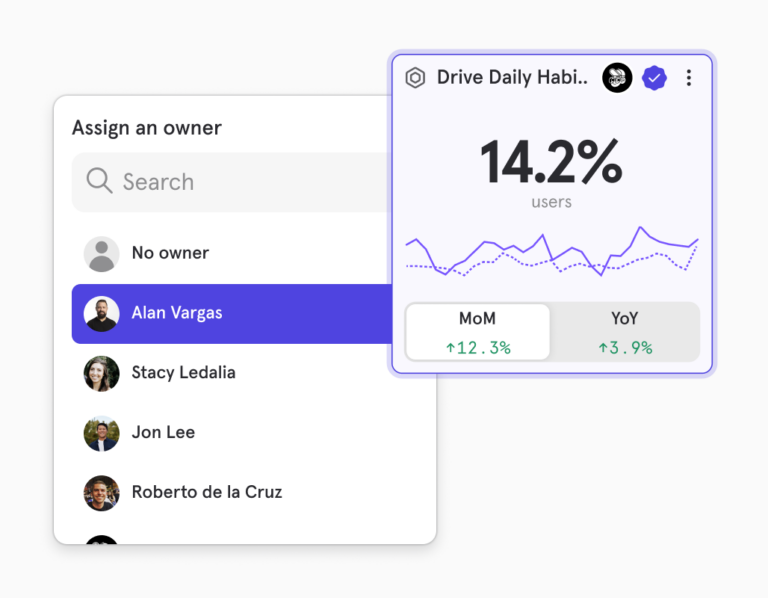
2. Assign an owner for each metric
Accountability is the key to fast, responsible decision-making. Every number in your metric tree should have a designated owner (whether an individual or a team) who understands what that metric impacts and can make decisions when they see changes. For example, the marketing team would own the campaign-specific marketing performance metrics we mentioned above.
3. Connect metrics to experiments and other reports for deep dives
Your metric tree is only as useful as the insights it gives you. When a metric moves unexpectedly—impacting the other “branches” of the tree—teams need to be able to dive into reports, experimentation platforms, user feedback systems, and analytics tools to understand why that metric is moving, and what they can do to fix it. Interconnected data and analytics platforms are the key not only to monitoring your data, but also to analyzing it and using it to make data-driven decisions.
4. Data governance and a log of actions for each metric should be kept for trust and transparency.
Building trust in your metrics is essential for making fast, confident decisions. You need to be sure that your data is accurate, calculated consistently, and truly reflects user behavior. To achieve this, you should clearly document how each metric is defined, perform regular data quality checks, and openly communicate any changes to your measurement methodology.
It’s equally important to maintain a record of the actions you take based on metric insights. When your marketing team adjusts campaign messaging based on churn data, that action should be logged with the rationale, timing, and expected impact. This creates an institutional memory that helps future team members understand why certain decisions were made and learn from past responses to similar metric movements.
5. Metrics should continue to evolve to match changes in your product or business strategies
Finally, your measurement framework needs to be flexible enough to adapt as your business grows and evolves. Events-based tracking schemas like metric trees allow you to modify your framework as time passes and your organization expands into new regions, or launches new products and features. The most effective teams regularly review their metric trees to retire metrics that no longer drive actionable insights and add new ones that align with current strategic priorities.
Metric tree example: Ecommerce
The company in this example sells clothing online. The product team wants a healthy pipeline of buyers coming through, so their current goal is to increase that number. They work closely with the growth and marketing teams to increase product reach. They want to get people in the door and optimize their onsite experience as much as possible to increase cart size and encourage repeat purchases.
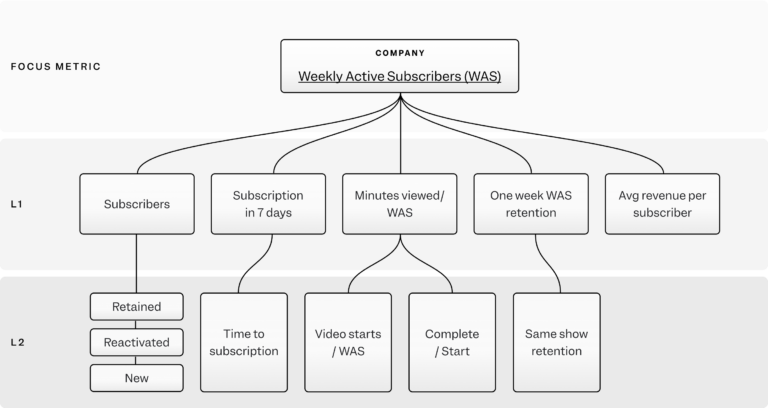
The metric tree below clearly shows how L2 metrics impact L1 metrics, which impact the focus metric.
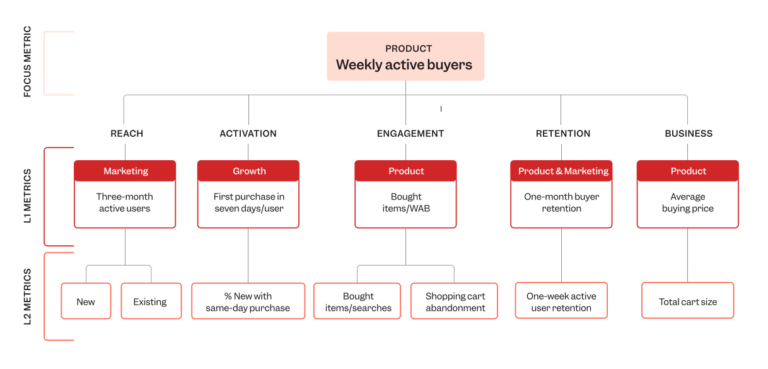
Here’s a breakdown of the values that make up this metric tree.
Focus metric: Weekly active buyers (WAB)
In this case, active means making a purchase. Site visitors who browsed may return, but aren’t included in the focus metric because they aren’t yet driving value for the business.
Reach: Three-month active users
The reach metric also includes people who have searched or browsed recently. This gives product owners a good sense of who may purchase soon. They’ve broken this metric into new users and existing ones and, among those, sorted by reactivated and retained.
Activation: First purchase in seven days/user
This tracks only the new user cohort and shows how many of them make a purchase within seven days of first searching or browsing. The sub-metric tracks the health of specific parts of the user journey, from showing up to purchasing.
Engagement: Bought items/WAB
Multi-item shopping trips are a fast way to increase revenue for this retailer. If the shopper has already found something they like and inputted credit card information, adding items to the cart is minimal incremental effort.
The L2 and L3 metrics dig into specific parts of the purchase funnel so the team can identify problem areas. If cart abandonment is high, they know to focus on streamlining the final stages of the buyer experience.
Retention: One-month buyer retention
This looks at whether buyers return to make another purchase the following month, which is in line with this company’s customers’ buying habits. To get more immediate feedback, the company tracks one-week retention of users who search or browse.
Business-specific: Average buying price
This metric measures the average price per item purchased. This company’s goal is to offer low prices, so they want this number to go down and the total cart size to go up. A luxury goods retailer would want a higher average buying price, but, in turn, wouldn’t expect a large number of items per purchase.
FAQ
- What's the difference between a metric tree and a KPI dashboard?
A metric tree is a hierarchical strategic framework for organizational alignment. It shows you how small actions impact each layer of your organization, all the way up to your North Star metric. KPI dashboards give you a broad overview of key company or team metrics. They’re great for monitoring performance, but they don’t show you how your metrics impact each other.
- How often should we update our metric tree?
Goals change and priorities shift, and the metrics you track should change to keep up. We recommend reviewing metric trees quarterly to retire metrics that no longer give you useful insights and to add new ones that support your current strategy.
- What tools do I need to build a metric tree?
To build a metric tree you need a digital analytics platform that connects your data into a single platform.
- Can small product teams benefit from metric trees?
Yes! Teams of all sizes can benefit from metric trees. Metric trees help with operational alignment and make it easier to prioritize actions that will have the greatest impact. Small teams with limited resources can use metric trees to get leadership buy-in, promote cross-team collaboration, and show the impact of product decisions. Contact us to get a Mixpanel metric trees demo or download our ebook to learn more.