


5 Best practices for creating a metrics strategy

The North Star metric has become a guiding light for organizations that want to promote internal alignment towards a shared strategic vision. By defining a single metric that is most predictive of success, and using that metric to steer decision-making, everyone works together towards a shared goal.
Or that’s the theory. In practice, it can be challenging for different teams with different KPIs to execute that shared vision on a tactical level. That’s why operationalizing your North Star framework with a clear metrics strategy is so important: It bridges the gap between strategic vision and tactical execution in metrics tracking.
Metric trees are one of the most powerful visual metrics strategy frameworks available. If your North Star metric is your compass, your metric tree is your detailed map. Here are five best practices for using metric trees to operationalize your growth strategy.
Best practice #1: Understand the metric tree foundation
A metric tree is a logical hierarchy of your growth model. Metric trees comprise a few key components: the focus metric and input metrics.
The focus metric sits at the top of your metric tree. It’s the metric that matters most to your business. Focus metrics are overarching measures of overall business performance. That said, they’re often lagging indicators—by the time a focus metric trends up or down, it can be difficult to work backward and understand what caused the impact.
Input metrics, on the other hand, are the drivers and dependencies for focus metrics. Most actionable feedback comes from input metrics, rather than focus metrics. Input metrics can be divided into several levels:
- Level 1 metrics impact the focus metric
- Level 2 metrics impact the L1 metrics
- L3 metrics impact Level 2 metrics, etc.
With this structure, every business metric connects to every other metric in a clear hierarchy.
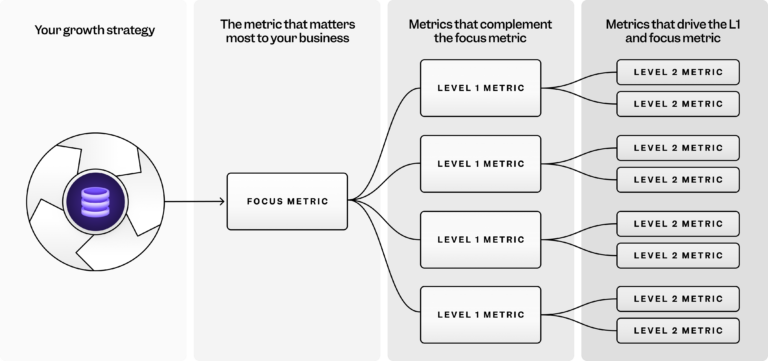
Metric trees start with the top-level metric (the focus metric, sometimes also called the North Star metric) that breaks down into branches that make up its constituent parts. Higher-level metrics are composed of (or influenced by) lower-level metrics, often through mathematical relationships.
Example: revenue
For example, revenue is an important indicator of business performance, and will often be used as a focus metric, or at the very least as an L1 input metric.
⚡ The revenue metric is itself made up of 2 metrics: Revenue = Number of users x Average revenue per user
If either of those metrics changes, revenue will change. If “revenue” is the focus metric, “number of users” and “average revenue per user” will be the two L1 input metrics that impact revenue.
These causal relationships map out the granular metrics and activities that impact performance. Visualizing the entire tree makes it easier to identify bottlenecks and diagnose problems.
Best practice #2: Design your focus metric strategy
No matter how many metrics you’re going to include in your tree, the first step to designing your tree is always the same: defining your focus metric.
Your focus metric is at the top of your tree, and it’s most closely tied to your top-line business priorities like revenue, growth, customer satisfaction, or a metric tied to active usage.
A focus metric should monitor value over a period of time:
Focus metric = Business / team value moment + Natural frequency
Examples: Video streaming and SaaS
A video streaming platform could use weekly active subscribers (WAS) as a focus metric because it shows potential for both revenue and cost reduction, since retaining users is cheaper than acquiring new ones, and active users are less likely to churn.
To choose your focus metric(s), ask yourself: “What are the things my company (or, for smaller trees, my team) wants users to do?”
The answers become a focus metric when transformed into usage-centric, time-bound measurements.
As an example, for a SaaS company, a focus metric could be monthly active users/seats within each customer account.
In a metric tree, focus metrics are always a top business priority, even if they aren’t the top tactical priority. They appear in every executive report because they efficiently show team or company health. But since they merely summarize trends from other metrics, they aren’t meant for day-to-day input. For that, you need to look lower down the tree at input metrics.
Best practice #3: Build actionable input metric hierarchies
Focus metrics guide your overall business strategy, but input metrics allow you to link the daily work of individual contributors and teams to that strategy. Every product UI change and marketing email announcing it should have an input metric measuring its success. These metrics then feed into higher-level product and marketing metrics.
To choose your input metrics, ask yourself: “What are the driving factors for our focus metric that my specific team or function controls?”
Each metric should be transformed into usage-centric, time-bound measurements.
When one input metric informs another, it’s layered beneath it in a sub-level (i.e., a level 2 input metric drives a level 1 input metric).
Example: Revisiting SaaS
In a SaaS company, for example, a level 2 input metric could be the usage rate on a new feature, while a level 1 metric might be a broader usage measurement of the suite of tools that feature belongs to.
Start with level 1 input metrics (L1s); these directly contribute to the focus metric. With a weekly active subscribers focus metric, a good level 1 metric would be 7-day retention to ensure you aren’t spending precious marketing funds to acquire new users who leave after a day or two.
Moving down the chain, level 2 input metrics (L2s) are even more specific and contribute directly to level 1 metrics.
To take the retention example one step further, the level 2 metric could be iOS app retention, and nestled under that could be a level 3 metric such as the retention of a regional iOS app or a specific feature within the app.
While adding many layers is possible, be careful not to create confusion. Too many goals can be as bad as having none, as teams won’t know where to focus.

Best practice #4: Turn metric trees into analytics hubs
Metric trees are a core element of your metrics strategy. They help you make smarter decisions more quickly, avoid unexpected impacts on other parts of the business, and promote alignment towards shared goals.
But metric trees can only do all of that if they’re used. Metric trees aren’t meant to be designed and then stashed away in a strategy doc, never to be seen again. They’re a central part of your analytics strategy, regularly referenced and used to drive decision-making.
Making metric trees accessible and part of your self-serve analytics environment is one of the key factors to building a lasting, data-driven culture. Another factor is accountability: Teams need to know which metrics their work impacts, what outcomes they are responsible for, and what shared goals are.
For example, if subscriber numbers climb but churn also rises, it should be easy for teams to look at their metrics on the tree to see how things like marketing campaigns or onboarding flows contributed to that outcome.
Best practice #5: Avoid vanity metrics
Vanity metrics are metrics that make you feel good but don’t tell you anything tangible about business performance. For example, website traffic and total page views can look good in a report, but it doesn’t necessarily translate to sales or conversions. Using vanity metrics in your metric tree also creates a false sense of success and hides real issues.
Vanity metrics usually:
- Lack actionable insights: They don't tell you what to change.
- Value quantity over quality: They prioritize volume over actual engagement.
- Hinder decision-making: They give an incomplete picture.
With all that in mind, vanity metrics aren’t universally bad: Sometimes, a vanity metric can offer insight with more context. For instance, “pageviews” isn’t usually a useful indicator, but "pageviews by marketing channel" can show how paid traffic affects a user's likelihood to return. Focus on metrics that directly tie to business outcomes and can guide specific actions, rather than impressive-looking numbers that don't inform decision-making.
Implementing your metric tree strategy with Mixpanel
Mixpanel enables you to operationalize your growth strategy by building metric trees directly within the same platform as your analytics, creating a unified framework for measurable growth while democratizing data access through self-serve analytics. Alignment and visibility in a single source of data truth help everyone work together to use metric trees for analysis and decision-making.
Real-time dashboards and alert systems give users early warnings that something has changed. When a metric in your metric tree fluctuates, you can click into that number to analyze what’s happening and quickly course-correct.
💡Pro tip: See how you can operationalize your growth strategy with Mixpanel Metric Trees!
From strategic vision to measurable growth
Metric trees align your organization, creating a coherent framework that connects the company’s strategic vision to tactical daily actions. Executive leadership can communicate their goals to the rest of the company, and each team member can clearly understand how their actions are contributing to the big picture.
Start building a metrics strategy that drives real business results with Mixpanel. Download the Beyond the North Star ebook to learn more.