

30 essential metrics questions to help your teams turn data into growth

Metrics aren't just for reporting—they're for creating a culture of curiosity and growth. While tracking raw data is essential, the real power lies in asking the right questions about the finished metrics.
Data is the ingredient (the clicks, the page views, the events); a metric is the recipe (a defined formula like 'Conversion Rate' or 'Customer Lifetime Value'). This distinction is crucial because only a healthy data-driven organization moves beyond simply reporting on "what" happened and dives into "why" it happened.
To ensure your valuable data turns into smart, proactive decisions, we’ve compiled a short list of questions to help your product, marketing, data, and engineering teams move from passive data consumption to proactive, data-informed decision making.
Foundational questions (all teams)
These questions should be a team's first step, regardless of their function. They ensure everyone is aligned on what they're measuring and why.
1. Are we looking at the right data, and do we have the same definition of each metric? If your analytics platform enables you to save metrics, everyone can define, save, share, and reuse key metrics across reports, dashboards, and teams, so everyone’s working from the same source of truth.
2. What's the "why" behind this metric? A metric without a clear purpose is just a number. This question forces teams to connect every data point to a business objective, user problem, or team goal. It helps teams prevent collecting "data for the sake of data."
3. Who is responsible for the metric going up or down? If there’s no clear answer to these questions, it’s probably a vanity metric and not as relevant to decision making.
4. Is this a leading or a lagging indicator? To build a balanced metrics portfolio, you need both. A leading indicator (like website clicks) predicts future outcomes, while a lagging indicator (like revenue) shows what has already happened. Focus on using your leading indicators to proactively influence the lagging ones.
5. What action will we take if this metric goes up, down, or stays flat? This is the ultimate litmus test for a useful metric. If a change in the number doesn't trigger a specific response, the metric may not be a key performance indicator. This question turns a static dashboard into a dynamic feedback loop.
6. Are we measuring a business outcome or just an activity? Distinguish clearly between metrics that show a result (e.g., customer lifetime value) and those that just show effort (e.g., number of emails sent). The most successful organizations focus on outcomes.
7. Are we consistently measuring the ROI (Return on Investment) of collecting and analyzing this data? This question challenges teams to quantify the direct business value gained from the resources spent on tracking, storing, and analyzing a specific metric.
Questions for product teams
Product teams are at the intersection of user needs and business goals. Their metrics should reflect this duality.
8. What are the core adoption metrics for our key features (e.g., Daily Active Users, Feature Usage Rate)? This establishes a baseline understanding of whether the feature is being used and by how many people.
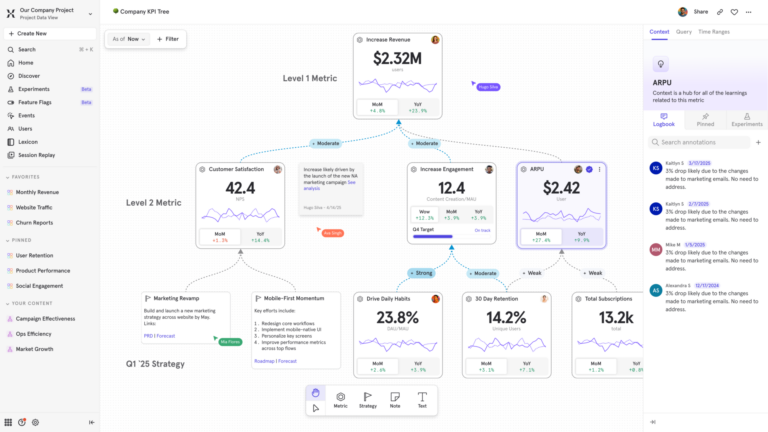
9. What is our North Star Metric, and how does this feature impact it? Remember, the North Star Metric is the single metric that best captures the core value your product delivers to customers. Every new feature, experiment, or change should be able to tie back to this metric, preventing feature bloat and misaligned efforts.
Pro tip: Turn strategy into action and see exactly how each of your team’s metrics ladder up to your North Star with Mixpanel Metric Trees.
10. How do we measure the impact of a feature after it's launched? The job isn't done at launch. The true test of a feature's success is its long-term impact on user behavior. This question encourages a culture of continuous learning and iteration by looking at retention, engagement, and how the feature affects the overall user journey, not just initial adoption.
11. Are we measuring what our users do or what they say? It’s critical to balance quantitative data (what users do in the product) with qualitative feedback (what they say in interviews or surveys). Quantitative data tells you 'what,' and qualitative data tells you 'why.'
Pro tip: You can combine session replay with heatmaps without leaving Mixpanel—so you can see the "what" and the "why" without switching tools!Learn more about Session Replay and Mixpanel Heatmaps.
12. How do we use feature flags to isolate experiment results and minimize risk (e.g., A/B testing strategy)? This connects the technical mechanism (flagging) with the strategic goal (experimentation), ensuring that product changes are deployed safely and tested scientifically before full rollout.
13. What are the counter-metrics we need to monitor? Every metric has a potential downside. For instance, if you push for higher "time on page," you must monitor a counter-metric like user satisfaction to ensure you aren't sacrificing user experience. Counter-metrics provide a holistic view, preventing unintended negative consequences.
Questions for marketing teams
Marketing metrics must clearly demonstrate their contribution to business growth, from brand awareness to customer acquisition and retention.
14. How does this metric connect to the customer acquisition funnel? Effective marketing measurement tells a story. This question helps teams connect the dots and understand how their work moves a user from a casual visitor to a loyal customer, from awareness all the way through to advocacy.
15. What is our Customer Acquisition Cost (CAC) and how does it compare to Customer Lifetime Value (LTV)? Your healthy business model requires LTV to be significantly higher than CAC. This shifts the focus from simply generating leads to acquiring profitable customers.
16. How are we leveraging data beyond the initial conversion (Retention and Expansion)? Marketing's role doesn't end at the first sale. Ask which metrics track upselling, cross-selling, and renewal rates, ensuring your efforts support customer loyalty and revenue expansion.
17. Are we measuring marketing's contribution to revenue, or just leads? While lead generation is important, modern marketing teams must demonstrate their impact on the bottom line. This question encourages a focus on sales-qualified leads, closed-won deals, and the revenue directly attributable to marketing efforts.
18. Which acquisition channels have the highest LTV/CAC ratio, not just the lowest CAC? The cheapest leads often churn the fastest. This question shifts focus from immediate cost savings to channel quality, prioritizing the sources that deliver the most profitable, long-term customers.
Questions for data teams
Data teams are the foundation for data-driven decision-making. Their questions should focus on the integrity, accessibility, and utility of the data itself.
19. How do we ensure the accuracy and consistency of our data? Garbage in, garbage out. The most brilliant analysis is useless with flawed data. This question highlights the critical role of data governance and the need for a data-first culture where data integrity is everyone's responsibility.
20. Are our dashboards telling a story or just displaying numbers? Challenge your team to move from data presenters to data storytellers by providing context and highlighting key insights.
21. Is this data accessible and understandable to the teams who need it? Data is only valuable if people can use it. This question addresses the need for clear documentation, user-friendly dashboards, and a culture of data literacy.
22. What is the right level of granularity for this analysis? This question addresses the importance of analyzing data at the right level—from a high-level trend to a specific user segment. It helps teams avoid "analysis paralysis" by focusing on the detail necessary to answer the business question at hand.
23. What is the lineage of this data point, and who is the current owner? To ensure trust and quick troubleshooting, every data point should have a clear origin (lineage) and an assigned steward (owner). This prevents tribal knowledge and speeds up bug fixes.
24. What assumptions are we making about user behavior that might skew this analysis? All analyses carry assumptions (e.g., that new users behave like old users, or that a metric change is intentional). Listing these assumptions helps mitigate cognitive bias and introduces healthy skepticism into the interpretation of results.
Questions for engineering teams
Engineering metrics should go beyond velocity and measure the health of the system, the efficiency of the development process, and the value delivered.
25. What is our current build success rate, and how often do deployments fail? This focuses on the most fundamental reliability metrics of the pipeline and system.
26. Do our metrics focus on value delivery or just output? The goal of engineering isn’t just to build things, but to deliver value to the user quickly and reliably. This question reframes the conversation around flow and efficiency, using metrics like deployment frequency, lead time, and cycle time.
27. Are we measuring team health, not just individual performance? Focusing on individual metrics like lines of code can create a competitive and unhealthy culture. This question shifts the focus to team-level metrics that measure collaboration, knowledge sharing, and collective efficiency.
28. How robust is our feature flagging infrastructure for controlling progressive rollouts and instant kill switches? This addresses the technical capability required to safely manage experimentation and continuous deployment, ensuring stability during feature rollouts and tests.
29. How do our metrics show the health of the system? Beyond shipping new features, engineers must maintain a stable and reliable system. Key metrics like mean time to recovery (MTTR), error rates, and uptime are crucial for proactive system health.
30. How do we measure the trade-offs between speed and quality? Every engineering team balances speed with quality. Metrics like change failure rate and defect escape rate help teams quantify the cost of rushing, enabling them to make smarter trade-offs and build a more reliable product over time.