

What is a North Star metric?

A North Star metric is the one measurement that’s most predictive of a company’s long-term success. To qualify as a “North Star,” a metric must do three things: lead to revenue, reflect customer value, and measure progress. If a metric hits those three points, and every department contributes to improving it, the company will grow sustainably—or so the theory goes.
Why is a North Star metric important?
Teams use North Star metrics to get everyone in a company focused on one goal. Ninety percent of the world’s data has been created in just the past few years and the profusion of analytical possibilities allows every department, every team, and even every contributor to chase their own metrics. If each team defines goals differently, they can work against each other and duplicate effort.
When startup investor Sean Ellis coined the term “North Star metric,” he intended it to reduce administration, simplify meetings, and align teams around the singular goal of growth. The term North Star metric—drawn from the common name for Polaris, the star that lies directly above the Earth’s Northern pole—is mostly rhetorical. Companies with complex business models can have multiple North Stars, and any given North Star metric is composed of sub-metrics anyway. Any company that literally foreswore all metrics in favor of just one, such as recurring revenue, would almost certainly fail. The North Star metric is, simply, an exercise in simplifying the overall company strategy into terms all can remember, understand, and apply.
When the Egyptians built the pyramids, the Earth had a different North Star—Thuban—but it’s crept out of alignment, just as Polaris will in time. Companies should feel equally free to reevaluate their North Star metrics to make sure they still point the right direction, and amend them when they prove flawed.
Benefits of a North Star metric
A North Star metric is meant to be a guide. It’s a compass pointing you in the right direction and keeping you focused on your primary goal of company growth and success based on what makes your customers happiest and keeps them coming back for more.
Specifically, having a North Star metric provides the following benefits:
1. Alignment
Although different teams will have their own sub-goals and metrics to focus on, having a North Star metric means the whole company will be aligned around the same goal and will be able to map their team’s goal to the North Star metric.
2. Transparency
A North Star metric, since it measures company progress, can give everyone in your company a bird’s-eye view of how the company is performing overall. This, in turn, can assuage employees who may be worried about the company’s future and thereby improve employee retention and reduce turnover.
3. Customer focus
Since your North Star Metric is the number that best reflects the value your company brings to its customers, it helps you stay focused on improving the customer experience in all ways, which has its own obvious benefits as far as bottom-line revenue and retention.
Fostering company-wide alignment, transparency, and a focus on the customer, your North Star is really the fuel to your growth engine. You can also see it as a type of glue or string that channels all the disparate goals and metrics from the various teams into a singular focus that drives your company to success.
North Stars and metric trees: Why you need more than direction
Even with these benefits, having a North Star is no longer always enough. While the North Star metric helps set strategic direction by pointing to where you want to go, it leaves a crucial gap: how do you get there?
This is where metric trees come in. A metric tree is a logical hierarchy of your growth model that maps how input metrics (at varying levels of granularity) feed into focus metrics, which in turn impact your North Star.
Often, teams declare a North Star and report on it periodically, maybe once a quarter or once a month. But that doesn’t help you identify why specific things have changed, like a sudden drop in user engagement or a spike in churn, because those shifts often happen at the input metric level, well before they show up in your North Star.
(Note: In the image below, “your growth strategy” is the North Star metric and the L1 and L2 metrics are input metrics.)
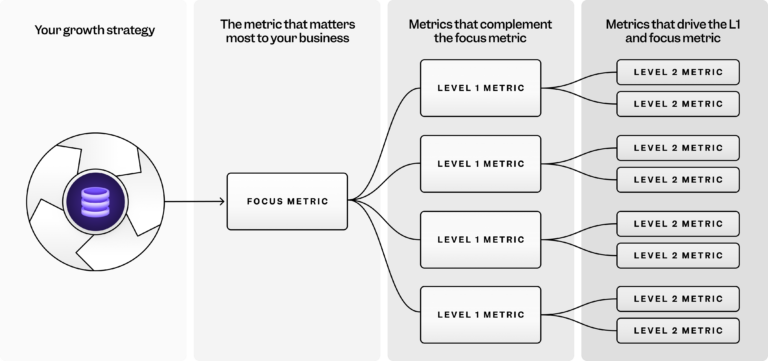
Metric trees let you visually map out these complex, multi-layered dependencies and provide a structured way to identify, prioritize, and track every contributing factor, from the smallest feature interaction or experiment to the overarching business objective. (We’ll look at metric trees in more detail in just a bit.)

North Star Metric versus The One Metric That Matters
It’s important not to confuse a North Star metric with "The One Metric That Matters" (OMTM), a concept from the book Lean Analytics. A North Star metric is a long-term guide, while the OMTM is for specific teams and projects over a fixed period (two to six months).
That said, using OMTMs can be beneficial for keeping projects on track, and OMTMs work to bolster the North Star metric by accelerating short-term goals and success.
How a North Star metric works
In daily use, a North Star metric is broken down into smaller metrics that drive accountability and ownership at the individual level. Many of these sub-metrics are team-specific and actionable, so individual contributors can draw a clear connection between their daily duties and the North Star.
Take, for example, an ecommerce company with the North Star metric “the number of new customers purchasing each week.” A merchandise buyer at that company could contribute to that parent goal by increasing sales in their category, whereas a web developer would contribute by reducing page load time. Both contribute, but in their own way. North Star metrics must also reflect the customer journey and measure whether users’ journeys are successful. In the case of the ecommerce company, measuring purchases indicates that buyers have completed their journey, and improving pieces of the journey—discovery, browsing, and checkout—speeds customers along and drives more revenue.
Examples of North Star metrics
Ecommerce
- Number of weekly customers completing their first order
- Value of daily purchases
- Customer lifetime value (CLV)
Consumer tech
- Number of daily active users (DAU)
- Number of messages sent per day
- Retention
B2B SaaS
- Number of trial accounts with over 3 users in their first week
- Percentage year-two retention
- Monthly recurring revenue (MRR)
Media
- Signups and retention
- Number of daily active visitors
- Total read time
- Total watch time
Fintech
- Total assets under management
- Number of daily active users
Making metrics actionable: From data to decision-making
Reporting on a North Star metric is just the beginning. The real impact comes from using metrics to drive decisions.
Most organizations have dashboards powered by real-time data to surface trends. But spotting a change isn’t the same as knowing what to do about it. Without a framework that clearly shows how metrics influence each other, it takes time to trace issues back to their root causes.
That’s where metric trees come in: by mapping the relationships between input and focus metrics, they help teams quickly identify what’s driving changes—and act before problems compound.
For example, if your North Star is weekly active users (WAU) and you notice a dip, looking through the input metrics on your metric tree may help you trace the decline back to a drop in sign-up conversions, which might be linked to a change in your onboarding flow or marketing campaigns. In other words, you can zero in on the root cause and take targeted action much faster.
💡 Mixpanel tip: Every key metric in your tree should have an owner accountable for monitoring it, interpreting changes, and initiating action. That doesn’t mean they solve every problem alone, but it does mean they don’t wait for someone else to notice an issue.
A marketing lead might own campaign-specific churn, while the product team owns retention overall. They know what “normal” looks like for their metric, and with self-serve access to real-time data, both teams can collaborate on solutions without bottlenecks.
Here are five ways to ensure your metrics are actionable:
- Connect metrics to context. Tie each metric to experiments, feature launches, user feedback, and A/B tests to quickly diagnose changes.
- Empower self-serve exploration. Give every team member, from PMs to marketers, direct access to metric trees without needing SQL or analyst support.
- Make your metric tree dynamic. Regularly review and update your metric tree to reflect new markets, products, and strategies—ideally once a quarter at least.
- Assign ownership and accountability. Ensure every key metric has a clear owner responsible for monitoring trends and acting on insights.
- Log decisions to build institutional memory. Track what actions were taken, by whom, and why, so teams can learn from past responses and move faster next time.
Pro tip: See how you can operationalize your growth strategy with Mixpanel Metric Trees!
Operationalizing your North Star
To influence growth meaningfully, you need a clear understanding of how your daily work impacts the North Star metric.
A metric tree is essential for this because it breaks down your North Star metric into actionable, operational components. Metric trees connect high-level focus metrics to lower-level input metrics, creating a clear chain of causality.
Focus metrics vs. input metrics
At the top of a metric tree sits a focus metric—a usage-centric, time-bound KPI that closely mirrors your North Star but is more granular. Focus metrics are usually mission-critical and appear in executive reports because they’re directly tied to your most important business values like making money, cutting costs, boosting customer satisfaction, or driving specific user actions. But while they’re great indicators of overall health, they’re often lagging and don’t help with daily decisions.
Focus metric = Business/team value moment + Natural frequency
To enable action, you need input metrics—the drivers of your focus metrics. These are the levers that quantify specific behaviors or changes, and that teams can directly influence.
A well-structured metric tree contains a few levels of input metrics:
- L1 input metrics directly impact the focus metric
- L2 input metrics influence L1s
- L3 input metrics contribute to L2s and offer even finer detail
This layered approach makes feedback loops actionable—rather than just reporting on your North Star metric, you can analyze what’s changed, identify why, and adapt your strategies accordingly.
Example: Video streaming company
For a video streaming company, a focus metric might be the number of weekly active subscribers (WAS), while an L1 input metric might be the percentage of new users who subscribed within seven days of their first visit:
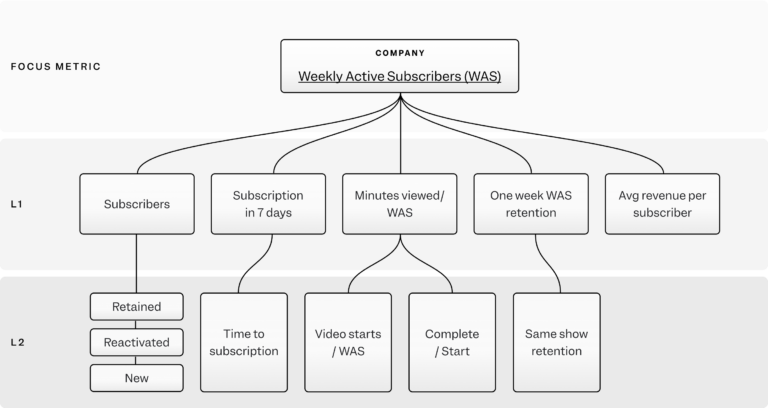
Many potential L1 and L2 input metrics capture different levers of growth—like engagement, activation, and retention—and collectively drive movement in the focus metric.
Learn more about operationalizing your North Star metric by downloading our ebook: Beyond the North Star.
How to find a North Star metric for your product
To find their North Star metric, companies must decide what is truly essential to the business. Companies are complex and succeed and fail for lots of reasons. But what are the pillars to the business that are, as an architect might say, load-bearing and that would ruin the company if they alone failed (i.e., they’re “too big to fail”)?
For many teams, those pillars are making customers happy, generating profit, and measuring progress toward those goals. A metric that simply makes money without satisfying customers will fail in the long run, as will a company that satisfies customers without being profitable. And a metric that doesn’t measure progress in a way that allows teams to act on its insights and change their behaviors isn’t useful. A North Star metric must reflect all three factors, tailored to each business. Some methods for identifying a North Star metric:
- Ask "What is essential to the business’s functioning?" Prioritize a list.
- Ask "What KPIs and metrics measure the top few key factors?"
- Ask "What metric encapsulates all of the above?"
- Build a metric hierarchy with the North Star metric on top of the pyramid.
Like a seed, North Star metrics need fertile ground to grow. Companies that select a North Star need the right culture and infrastructure. Without cross-silo relationships and a willingness to prioritize the company good above the team good, some employees may reject the North Star metric, especially if they must change their behavior significantly, or if, like many sales teams, their compensation structure presents a conflict of interest.
“An effective north star metric is a product manager’s best friend. It provides cross-functional alignment on goals and tasks, and an objective barometer for success when a product ships. Even products that generate direct revenue require an alternative product metric that tells a more holistic story of what’s going on. When your north star metric is clear, product ideation becomes a lot easier. Instead of asking yourself 'What should I build next?' you should be asking 'What feature or product is most likely to move this metric the most?”
Measuring progress against your North Star metric over time
Companies also need the right analytics platforms to measure progress toward their North Star metric and sub-metrics. Without user-friendly analytics that teams can access at a whim, companies can’t tell whether they’re succeeding and can’t course-correct.
Most teams find product analytics (or user analytics) vital to measuring their North Star metric. Product analytics provide user-level insights that most analytics platforms—especially free ones—don’t capture. More specifically, user analytics can:
- Track individual users across platforms
- Generate reports and dashboards
- Use machine learning to detect anomalies in the data
- Offer a user-friendly interface so the whole team can access insights
With powerful analytics, any team can easily see both how their own metrics are fitting into their company’s North Star metric and whether or not they need to course-correct to better support the North Star metric. When paired with a well-structured metric tree, these analytics don’t just track progress—they clarify which actions drive it and help teams focus on what moves the needle.
“Great PMs understand that their specific product’s context is a more important factor for defining metrics than any industry best practices. Creating a north star metric has its benefits–chiefly, simplicity in measuring progress and communicating it within and outside the team responsible for the product.“
Example of using product analytics for a North Star metric
Let’s use the cycling and running app Strava as an example, theory-crafting based on what a product designer and Strava user would do.
Strava is a SaaS company that offers a free plan but generates most of its revenue from monthly subscribers that share certain attributes:
- They most frequently use the same features.
- The features that subscribers use the most are the features responsible for renewed subscriptions.
- Hence, these features keep the monthly revenue flowing.
- And, these are the features users view as valuable enough to pay for.
Strava’s North Star metrics should thus tie directly into the features the paying customers use, and Strava can (and should) use product analytics to find the answers to these questions:
- How often are paying customers using a certain feature?
- How often are paying customers sharing their use of that feature with non-paying customers?
- What’s driving paying customers to keep using these features?
Product teams can then experiment and see if their ideas can increase the use of a paid feature and also the number of free users trying that feature. They can use product analytics to inform the answers to these questions:
- How can Strava get non-paying customers to try paid features?
- Once a free user starts a trial, how can Strava get users to renew?
- What can Strava measure in the product as an indicator that will lead to new paying customers?
Then, once Strava establishes its North Star metrics, it can use a platform like Mixpanel to monitor those metrics, with the focus being on whether the North Star metrics are improving and why.
By layering in a metric tree, Strava could also map how each team’s experiments and product changes connect to those metrics—creating a real-time decision-making model that ensures effort is aligned, measurable, and directly tied to outcomes.
Can companies aim for more than one North Star?
Companies typically have only one North Star metric. However, a single north star can be limiting, especially if your company has multiple core products with separate goals—i.e., a music streaming service looking for both more music subscribers and paid podcasts. As such, we prefer the softer framing of a “focus metric” working in conjunction with other key performance indicators (KPIs).
For more on how to find your focus metric, go here.
Scaling your metrics strategy: From individual teams to company-wide alignment
Metric trees don’t need to start with a grand organizational blueprint. Sometimes the most successful implementations start small—with a single team mapping the metrics they control—and grow organically from there.
1. Begin with what you control
It’s common to start by building metric trees at the team level. For example, a marketing team might create a tree focused on campaign performance and retention. This makes the strategy actionable from day one, helping individual contributors see how their day-to-day efforts tie to outcomes. When team-level metric trees reflect actual responsibilities, it’s also easier to assign ownership, make faster decisions, and build confidence in the system.
2. Connect metric trees to the North Star
As multiple teams develop their own trees, these should connect upward to a company-wide North Star metric and mirror your organizational goals. Marketing’s tree might roll up to a focus metric like customer acquisition, while product and engineering trees might tie into engagement or retention. This becomes a holistic view of how every part of the business contributes to shared success.
3. Drive adoption with thoughtful change management
Scaling a metric tree strategy is as much a cultural shift as it is a technical implementation. Teams need to be brought into the process early. They should help define the metrics they own, understand how their data is being used, and see the value of the metric tree in improving their own decision-making. Leadership support is critical—when C-level sponsors use and reference the metric tree, it sets the tone for the rest of the organization.
4. Build for trust and transparency
As your metric trees grow, governance becomes essential. Every metric should have clear documentation—how it’s defined, calculated, and where the data comes from. Changes to any metric, thresholds, or definitions should be communicated broadly. It’s best to maintain a log of decisions tied to metric shifts (who acted, when, why) to ensure continuity and help new hires ramp up quickly.
It’s time to find your North Star
North Star metrics can be an effective strategy for aligning all teams around a singular goal, provided they’re not taken too literally, are supported by a flexible culture, and measured with analytics solutions that help teams tell whether it’s still guiding the way.
Remember that your ultimate goal is growth and success, and sometimes you’ll need to pivot and rejigger or reframe your North Star metric (or focus metrics) to reflect your company’s new mission. In that sense, it’s always okay to backstep and rethink things, as the last thing you want is to be chasing the wrong star. Learn more by downloading our ebook, Beyond the North Star, or get started with Mixpanel for free and start testing, refining, and tracking your most important metrics in one place.