

Product adoption: How to measure and optimize user engagement

TL;DR: Product adoption is the process by which users discover a product, find value in it, and integrate its use into their lives. Product adoption is key to product success and serves as a valuable indicator of long-term success.
User acquisition matters, but it’s only the first step to driving product growth. For sustained success, you need to master product adoption. Otherwise, you’ll acquire users who won’t stick around, and you won’t be able to grow your business.
Let’s talk about the product adoption curve, product adoption metrics that matter, and strategies to accelerate product adoption.
What is product adoption?
Product adoption is the process by which users discover a product, find value in it, and integrate its use into their lives. Product adoption is key to product success and serves as a valuable indicator of long-term success.
Several key metrics help measure product adoption (more on this below).
Product adoption vs. user acquisition vs. engagement
User acquisition is the first step of product adoption. If you don’t acquire new users and introduce them to your product, they won’t be able to adopt your product. User acquisition involves marketing to increase awareness and introduce new potential customers to your product.
Product adoption goes well beyond measuring those initial signups. It’s tied to users finding value and forming a habit of using your product.
Product adoption happens when users find success with your product and can use it to accomplish their goals.
In other words, user acquisition is a small part of product adoption.
In a similar vein, user engagement is necessary for product adoption, but only a portion of it. User engagement measures the frequency with which users engage with the product (usually by performing certain key actions). Product adoption goes a step beyond that and looks at whether users are finding value and whether they have formed habits around using the product.
To increase product adoption, product managers work on improving a product’s ease of use, and optimizing product onboarding and feature discoverability.
Product adoption significantly impacts customer lifetime value (LTV), lowers churn, increases revenue, and paves the path to sustainable growth.
Why adoption matters more than vanity metrics
Vanity metrics are numbers that look good but don’t tell you anything useful about performance or what to do next. Unlike vanity metrics, product adoption (and the metrics used to track adoption) are tied to business impact and focused on user value. Vanity metrics often make you feel good, but they’re misleading; identifying them allows you to focus on metrics that really matter instead.
The product adoption curve: Understanding your users
The product adoption curve illustrates the idea that there are different types of technology “adopters” in the marketplace, depending on how open they are to a new technology or product and how likely they are to take a risk on new ideas.
The idea comes from researcher Everett Rogers’ 1962 book Diffusion of Innovations, in which he outlined five user categories with different adoption patterns:
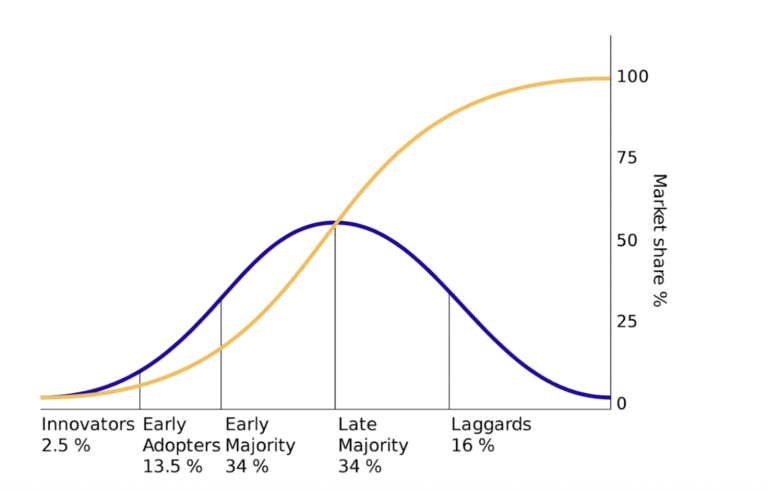
The categories (based on Rogers’ research) are innovators, early adopters, early majority, late majority, and laggards. According to Rogers, products need to evolve as they grow to meet the needs of these different user categories.
💡Pro tip: Behavioral segmentation can help you understand different types of users and what they value.
The five user types and their adoption patterns
The product adoption lifecycle looks at how quickly different types of users are likely to adopt a new tech product:
Innovators (2.5% of people)
Innovators are tech enthusiasts who are excited to try new technologies. They’re usually younger, have more disposable income, and are more closely connected to sources of innovation (startup founders, tech workers, venture funds, entrepreneurs, etc.).
Early adopters (13.5%)
Early adopters are often opinion leaders or influencers who make up a little over a tenth of the total population. They keep track of innovations and what’s happening in the market, but they’re more selective than innovators.
Early majority (34%)
The early majority are practical users who need social proof before adopting a new product. They are more risk-averse than early adopters and innovators, and look to those groups before deciding to invest in a product.
Late majority (34%)
Late adopters tend to be skeptical about the benefits of a new product. They adopt later than the average user, from a place of necessity rather than enthusiasm.
Laggards (16%)
Laggards are resistant to change and not likely to be influenced by early adopters or majority adopters. This group is more focused on the reliability of their existing products and tends to have limited financial resources for risk-taking.
Crossing the chasm to mainstream adoption
The product adoption curve helps you understand different user segments and their characteristics. To successfully achieve mainstream adoption, you need to build a product that meets the needs of all of these different users: Innovators are the ones who will sign up to beta test products and love trying new products, for example. They want early access, opportunities to give feedback, and a chance to try something new. Early adopters see the potential in a new product. They want the value it can deliver, and will tolerate some bugs or UX clunkiness *if* there is also a compelling roadmap and improvement plans.
Early majority adopters have different priorities: They want a proven approach, with tangible benefits and a complete solution.
The gap between these early “visionaries” and late “pragmatists” is called the “chasm,” a term first coined by Geoffrey Moore in 1991. He argues that crossing the chasm between those early adopters and majority users is one of the critical challenges a technological company faces. To cross the chasm, companies need to shift their strategies from targeting those early users to building more complete, finished products that solve the needs of a specific market segment.
Analytics can help identify and target each user segment and build solutions that deliver value for them.
Product adoption metrics that drive results
Several product adoption metrics will give you valuable insights into your performance and help drive product-led growth.
Time to value (TTV)
Time to value measures how quickly users recognize value from your product (also called reaching their “aha” moment).
The sooner users understand the value that your product delivers, the more likely they are to continue using your product and make it part of their routine.
Some strategies to improve time to value include optimizing onboarding, offering fast and efficient customer support, and communicating value clearly and quickly.
Activation rate and feature adoption
Activation rate and feature adoption are both valuable indicators of product adoption. Look for activation events beyond signups, that show that users have achieved value from your product.
For example, Mixpanel users see value from our product when they use our analytics to explore their data, as Group Product Manager Neha Nathan explains:
“Opening a report doesn’t mean they’ve seen value from Mixpanel. Our platform’s value is in being able to explore your data and go deeper,” she says. For us, an activation event wouldn’t be viewing a report—it would be a metric tied to that exploration and to achieving that value.”
Higher feature adoption rates mean that users are finding and getting value from your features. If they aren’t using your features, that’s an indicator that you aren’t directing your time and resources to build the functionality that users want. Measuring feature adoption across different user segments can give you more granular insights that will help tailor messaging and targeting.
Product stickiness is also an important metric for product adoption and engagement. It’s usually calculated using the DAU/MAU ratio, which compares the number of daily active users to monthly active users.
Other methods to track product adoption: Creating adoption funnels and cohort analysis
Funnel analysis helps you spot conversion opportunities and increase engagement. Mapping user journeys from sign-up to adoption gives you insights into where users are dropping off and spot where you can make improvements. Features like cohort retention analysis help you understand adoption patterns and improve your product experience.
Strategies to accelerate product adoption
The faster users see value in a product, the more likely they are to adopt that product and continue using it in the future.
Optimize onboarding for faster time to value
Onboarding flows and progressive disclosure of functionality and features help users get accustomed to your product without feeling overwhelmed. The main goal of onboarding is to reduce friction to that first value realization. You can do this with behavioral triggers to create guided experiences—for example, prompting a user to explore a more advanced feature after they’ve mastered the basics.
⚡Customer story: Learn how Elavon used Mixpanel to achieve 70% faster implementation and 2x their conversions.
Drive ongoing adoption through data-driven insights
Product adoption is an ongoing process, and users who cease to get value from your product will churn. Continuous experimentation and A/B testing onboarding and adoption flows ensure that your product and roadmap remain relevant to your users over time. Re-engagement campaigns for at-risk users and targeted in-app messaging based on user behavior prevent disengaged users from falling through the cracks.
Common adoption challenges and solutions
There are a few common adoption challenges that many digital products encounter.
Adoption challenge 1: Users sign up but never activate
This fairly common issue indicates that your onboarding flow may need tweaking, your value proposition might be unclear, or you might need to fix some technical issues. Use funnels to identify drop-off points, streamline and optimize your onboarding process, and diagnose and solve any glitches.
⚡Customer story: Read how Sunrun used Mixpanel to drive adoption of the mySunrun app by 50%+.
Adoption challenge 2: High initial engagement, low long-term adoption
The key to increasing long-term adoption is encouraging your users to build habits around your product. Building habits will look different for different products and industries: Insurance companies might have high engagement with new users as they create their account, customize their profile, etc. But then don't interact with the app until they either need to file a claim, submit a complaint, or renew the policy.
Consistent, long-term engagement isn’t always achievable, but companies should still strive for it as much as possible.
📈Industry data: Read our 2025 State of Fintech Product Analytics to learn more.
How Mixpanel transforms product adoption measurement
Digital analytics solutions like Mixpanel are the linchpin of your product adoption strategy. Event-based tracking gives you precision adoption insights and helps you gain a deeper understanding of user behaviors. Self-serve analytics without SQL dependency allows you to monitor adoption metrics and behaviors in real time to see exactly when and how users are realizing value.
Behavioral segmentation helps you get more granular with your targeting and build personalized adoption optimizations. And by providing you with a shared source of truth, Mixpanel helps your product, marketing, and engineering teams gain collaborative insights and align around shared adoption goals.
Start optimizing your product adoption today. Try Mixpanel for free.