

What are vanity metrics? Insights from the Mixpanel team.

Vanity metrics are metrics that lack actionable insights and prioritize volume over engagement, without providing useful information about performance. Focusing on vanity metrics can lull organizations into a false sense of security and hinder decision-making.
Vanity metrics are metrics that look impressive but don’t have an impact on actual business performance.
The temptation to follow vanity metrics is real. Vanity metrics look good, and looking at them makes your team feel good. But when you scratch the surface, those numbers aren’t telling you anything useful, and they can even be misleading. Vanity metrics distract you from what really matters.
But vanity metrics also aren’t the same for all organizations: What might be a trivial number for one organization can be critical for another. It’s important to understand how to evaluate metrics and spot which ones are useful in decision-making.
To help with this, we spoke to our team across product, analytics, and marketing to get their insights on what makes a vanity metric for different teams, how to avoid them, and what to track instead.
Vanity metrics, defined by product, analytics, and marketing teams
Mixpanel Senior Product Manager DJ Satoda summarizes what makes a vanity metric like this:
“Vanity metrics have two unifying factors: They don’t drive a key decision, and they aren’t directly tied to a user’s sense of value (or lack of value) in a product.”
For example, cumulative numbers like total visits or total number of registered users often look good on paper—by definition, they can only go up—but they lack important context.
“Even when the number of total registered users is growing, that doesn’t tell you whether these are valuable users, if they’re the type of users you want, or how much you paid to acquire them,” warns Gio Bryden, Senior Manager, Solutions Engineering at Mixpanel. Looking at those numbers without that context can “lull you into a false sense of security,” he adds.
In general, any “raw” numbers, like numbers of users that engaged with X feature, or number of new signups, should be treated with suspicion. “It’s not that those numbers are bad to know, but they lack the context to make them useful,” says Senior Product Manager Jenna Bono.
To summarize, a vanity metric:
- Doesn’t drive actionable decisions
- Lacks connection to user value
- Can’t be mapped to business outcomes
- “Looks good” without giving you meaningful insight
These are useful general guidelines for defining a vanity metric. Now let’s look at concrete examples of possible vanity metrics for different teams.
Real examples of vanity metrics: What the Mixpanel team avoids
It’s important to understand that what will be a vanity metric for one organization might be a core performance metric for another, highlights Principal Solutions Engineer Aaron Krivitzky:
“For one company, time spent watching a video would be a total vanity metric, but for a company like YouTube, time spent on a video is a very important metric that they’re actively trying to control.”
With that caveat out of the way, here are a few examples of vanity metrics for different teams, along with explanations of why they aren’t useful metrics to track, and what to track instead.
Product and analytics vanity metrics
These metrics depend on the type of product you’re working on and its value proposition. For example, one of Mixpanel’s core features is Reports. Users look at Reports to see analysis results.
Viewing a report is a good first step, but it’s not where users find value from Mixpanel, Group Product Manager Neha Nathan explains:
“Opening a report doesn’t mean they’ve seen value from Mixpanel. Our platform’s value is in being able to explore your data and go deeper. Viewed reports and opened reports are all vanity metrics for us, because they don’t show any engagement. I prefer to look at how many users have done exploration, and consider those people active users.”
By tying “active users” to a clear value moment, she has a clearer picture of the number of engaged users who get real value from Mixpanel.
In a similar vein, the total number of signups doesn’t give you much insight into product health, because it isn’t tied to revenue or value. Gio Bryden weighs in:
“Conversion rate to paid is a more direct measure of a product’s ability to generate revenue, not just bloat user count. Tracking this metric helps you understand if the users you’re attracting are the right audience for your paid offering and if your pricing and value prop are effective.”
Marketing and growth vanity metrics
A lot of commonly used marketing and growth metrics like page views, impressions, and even cost-per-click (CPC) can easily become vanity metrics, Senior Global Campaigns Manager Claire Alloway tells us. “They’re leading indicators or a popular campaign or content piece, but ultimately, I’m responsible for driving leads and controlling the cost per lead. You can have a spike in traffic, but it’s easy to hide in the data with vanity metrics,” she says. For demand gen, she recommends focusing instead on pipeline, and leading indicators like MQLs and time from MQL to a qualified opportunity.
Another important factor when evaluating metrics is how close or far they are from your end goal, says Claire:
“If I had 20% vs. 30% open rates on webinar invite emails, that would affect how I write future subject lines. But it wouldn’t necessarily change how I plan webinars, or even write the email body copy itself.”
Email open rates aren’t necessarily a vanity metric, but they do give us limited visibility into the success of the webinar itself, and it’s important to remember that when making changes.
Melody Yin, Mixpanel’s Senior Revenue Strategy and Operations Manager, also points out that focusing on the ROI of brand awareness campaigns can be misleading. “Many powerful marketing campaigns, such as out-of-home (OOH) and PR campaigns, are very difficult to evaluate based on ROI,” she says. Instead of ROI, she recommends using brand lift studies and applying them for at least a few months to account for lag time.
Sales and revenue vanity metrics
When it comes to revenue vanity metrics, be suspicious of sales pipeline numbers, Akaash Mungale from the Data Scientist team says:
“[Pipeline] can often be a vanity metric because revenue from potential deals is often inaccurate, can be inflated, and can be delayed.”
He recommends adding counter metrics like conversion rate or qualified pipeline, “to make sure you’re not just patting yourself on the back from generating tons of potential revenue that may not materialize.”
More generally, activity metrics add little value: “Things like dashboard created, lines of code pushed, number of leads created, or tasks completed can help people look busy, but they don’t give you any insights into the impact of the team’s work,” he says.
Usage metrics that mislead
Finally, even if they aren’t outright vanity metrics, non-normalized usage metrics such as monthly active users (MAU) can be misleading when you don’t control for factors such as spend or user count. Mixpanel’s Senior Data Scientist Caleb Lam provides his thoughts:
“It’s simple to declare that an account with a higher MAU is healthier than one with a low MAU. However, when comparing customers, you won’t be able to accurately compare large enterprise customers with a smaller SMB customer or startup. Enterprise customers would have naturally larger MAUs, but may not necessarily be healthier than the SMB customer.”
Instead, Caleb recommends using customer analytics to normalize or cohort customers into similar profiles to make raw metrics like MAU useful. “For example, using MAU/MRR or MAU/employee count will let you compare customer usage across cohorts and really pinpoint which customers are using your product healthily compared to their peers, no matter the size,” he says.
The Mixpanel team's framework for identifying vanity metrics
The purpose of analytics is to measure the inputs that we can control—things like marketing spend, product features, or operating budget—and the important outputs we don’t have direct control over, like sales, purchases, or subscriptions. Having that information gives us the complete picture of business performance.
“Anything that isn’t a discrete input and output ends up being a vanity metric, because it doesn’t control a process or help with decision-making,” says Aaron Krivitzky.
When Aaron works with Mixpanel customers to help them optimize their analytics, he often helps them identify and discard vanity metrics.
“When customers say they have an important metric, I will ask them to map that metric to an input we can control or an output we don’t have direct control over, and ask them who is responsible for that metric going up or down. If there’s no clear answer to these questions, it’s probably a vanity metric.”
Here are a few questions you can ask to identify vanity metrics.
The accountability test:
- Can you identify who is responsible for improving this metric?
- Is there a clear action plan when the metric moves?
The value test:
- Does this metric connect to user value?
- Would this number going up or down reflect an impact on the user?
The decision-making test:
- Does this metric inform specific business decisions?
- Can you take different actions based on this metric's performance?
The context test:
- Does this metric provide actionable insight on its own?
- What additional context is needed to make it meaningful?
- Am I monitoring the right guardrail metrics?
What to track instead of vanity metrics: Recommendations from Mixpanel's team
From reading this article, you may worry that all metrics are vanity metrics. But that’s definitely not the case! Here are some tips and examples of what metrics you should track.
Outcome-focused product metrics
The best product metrics are measured per user, non-cumulative, and tied to key moments of user value and the outcomes you want to produce.
Examples:
- Feature adoption rates (not just usage counts)
- User retention by behavior cohort
- Conversion rates between key user actions (tip: use Funnel Reports to analyze these)
Quality-focused marketing metrics
Demand gen metrics should be focused on leads generated and associated costs, not just clicks and campaign views.
Examples:
- Cost per qualified lead (not just cost per click)
- Lead-to-customer conversion rates
- Customer lifetime value by acquisition channel
Contextual business metrics
It’s useful to pair metrics with counter metrics to give them the context they need to be valuable. A metric that isn’t useful on its own can become useful when paired with other metrics.
Examples:
- Sales pipeline paired with conversion rates
- Revenue growth combined with retention rates
- Usage metrics normalized by relevant factors
Engagement depth over volume
Metrics that give you a sense of how engaged your users are will always be more valuable than surface-level metrics that don’t show actual engagement, like signups or clicks. These metrics will be largely dependent on your product. As Neha mentioned above, for Mixpanel, simply looking at a report isn’t the true value moment for Mixpanel users. Look for metrics that go beyond surface-level engagement and indicate real value delivered.
Examples:
- User actions that indicate value realization
- Metrics that indicate the depth of product engagement
- Behavioral indicators of product-market fit
How Mixpanel helps teams focus on meaningful metrics
Unlike platforms focused on pageviews and surface-level metrics, Mixpanel tracks the user behaviors and product interactions that give you actual insights into performance and help drive decision-making.
Mixpanel’s interconnected analytics platform can sync directly with your data warehouse, thanks to Mirror Mode and Warehouse Connectors.
It gives you access to the metrics and the additional data layers you need to understand the context behind those metrics to make them actionable.
Data governance features and tools like Lexicon and Saved Metrics keep teams aligned behind data definitions, so you know you can trust the numbers.

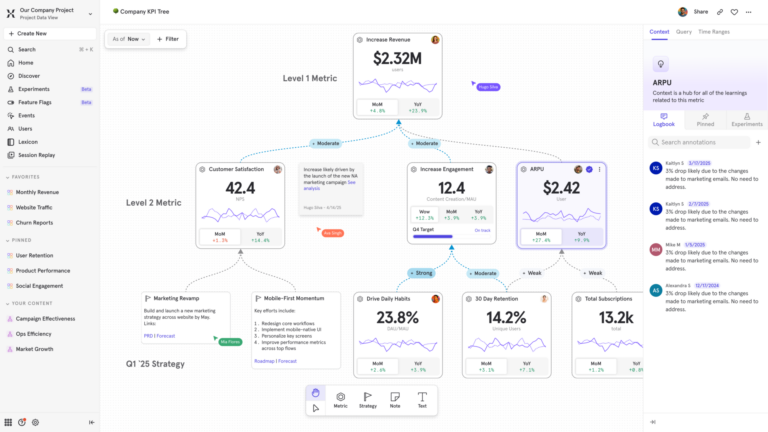
Tools like Metric Trees show you exactly how different metrics and actions impact each other, so you know which levers to pull to improve KPIs.
User segmentation and cohort analysis help you understand your customers better, identify valuable segments, and gain a deeper understanding of user engagement.
Most importantly, Mixpanel is built for outcome-based reporting: You can intuitively see how metrics connect to user value and business goals, so you can drive even better decision-making as you move forward.
Key takeaways from the Mixpanel team
Having the right tools and processes in place will help you get the most out of your analytics and avoid chasing vanity metrics. But in our opinion, the true differentiator is having a great team in place that understands how to analyze and interpret data, along with a self-serve analytics platform that makes this possible.
Prioritize substance over vanity with a few core strategies:
- Test for accountability: Every metric should have a clear owner and action plan
- Connect to user value: Measure what matters to users, not just what looks impressive
- Add context: Raw numbers without context are rarely actionable
- Use counter-metrics: Balance primary metrics with measurements that prevent gaming
- Normalize for comparison: Make metrics comparable across segments and time periods
Any data-curious team can learn to spot vanity metrics with the right tools and training. Move beyond vanity metrics today and focus on metrics that matter with Mixpanel. Get started for free.