


The 20 digital analytics metrics that matter most

Digital analytics metrics measure user behavior across digital touchpoints to drive business decisions.
Every product decision starts with a question: Are users finding value? Which features drive engagement? Where are people dropping off?
The answers live in your data—but only if you know what to measure.
Digital analytics metrics are measurable data points that reveal how users interact with digital products. They transform raw user behavior into actionable insights that guide product strategy, marketing decisions, and revenue growth.
The challenge isn't collecting data—most companies have plenty of that. The real challenge is knowing which metrics matter most, what they reveal about user behavior, and how to use them to drive meaningful improvements.
Let's explore the essential digital analytics metrics to track, how to choose the right ones for your business goals, and common mistakes that lead teams astray.
20 Essential digital analytics metrics to track
Product managers need to track customer lifecycle metrics, from initial acquisition to engagement, conversion, and retention, to increase revenue and deliver personalized customer experiences. We’ve broken down some of the most important digital analytics metrics into those categories to make them easier to understand.
Acquisition metrics
Acquisition metrics help you track how well you’re attracting and acquiring new customers.
Traffic sources and conversions by channel
Knowing where your visitors come from is useful, but it doesn’t help you much if those visitors don’t convert. Breaking down conversions by channel gives you insights into how different channels are performing and which channels lead to the most conversions.
Click-through rate (CTR)
CTR is the percentage of people who click on a link after viewing it. CTR helps evaluate ad and content performance.
Cost per click (CPC)
CPC tells you the average cost for each click on your paid ad campaigns, which helps determine their ROI and effectiveness.
Pro tip: Analyze CTR, CPC, CPA, and other ad spend data with Mixpanel.
Cost per acquisition (CPA)
Cost per acquisition measures the cost of acquiring conversions from a campaign. It’s a tactical metric that gives you a granular view into campaign performance.
Customer acquisition cost (CAC)
Customer acquisition cost tells you how much it costs to acquire a customer. In addition to factoring in costs like sales and marketing spend, it also includes numbers like overhead, salaries, and equipment costs to paint the full picture.
Pro tip: Check out our marketing KPIs demo board for more insights.
Engagement metrics
User engagement tells you whether users are finding value from your product. If users are engaged, they’re more likely to be willing to pay for your product, and stick around.
Different companies will measure engagement differently, based on what they offer: a media company might prioritize daily usage or time spent on page, for example, while an ecommerce store might look at the number of items added to a cart.
Feature adoption rates
Feature adoption rates measure how many users engage with a feature within a set time period. It tells you how much value users get from this new feature and can help shape future product decisions.
Pro tip: Read more on how to increase feature adoption.
Session duration
Session duration measures how much time a user spends on a website or product during their visit. Longer sessions can indicate that users are getting more value from your product and are more engaged.
It’s important to combine session duration with other metrics and monitoring. For example, a user who can’t find what they’re looking for might spend longer clicking around on a website trying to find something. That doesn’t mean they’re getting more value from their visit, even if their session duration is longer. Features like Session Replay give you a more complete picture of on-site user behavior.
Pro tip: Combine session replay with heatmaps without leaving Mixpanel—so you can see the "what" and the "why" in one place.
Page views per session
This measures the average number of pages a user visits during a single session. Like session duration, it gives you an idea of how well your website or product holds your user’s attention and delivers value.
Bounce rate
Bounce rate measures the percentage of users who leave your website or product after viewing only one page. High bounce rates can point to a problem with your website or product. Deeper analysis will give insights into why the bounce rate is high, rather than simply allowing us to observe that it’s happening.
Pro tip: Track your website analytics with our web analytics template.
MAU, DAU, WAU
Monthly, daily, and weekly active users (MAU, DAU, and WAU) measure how many users have taken a meaningful action in your product in a set timeframe. These are good indicators of user engagement that go beyond signups or simply opening your app. The DAU/MAU ratio is also frequently used to calculate product stickiness.
Pro tip: Learn more about digital analytics engagement metrics in our guide to product analytics.
Bonus engagement metric: User activity patterns
User activity patterns are not a single digital analytics metric, but rather include the sequences of actions users take within your product. Event-based tracking helps you build a complete picture of user activity and gives you granular insights into user behavior. Funnel analysis helps you understand in-product user journeys, and breaking users down into cohorts helps you spot patterns and understand which users are the most engaged.
Retention and conversion metrics
These digital analytics metrics tell you how well your users are converting and whether they’re sticking with your product.
Retention rate
Churn rate
Churn rate is the opposite of retention: It measures the percentage of users who leave your product within a certain time period. Churn analytics help you measure, understand, and prevent churn.
Conversion rate
This measures the percentage of users who complete a desired action (i.e., convert). Funnel analysis helps you spot and solve conversion problems.
Customer lifetime value (LTV)
This measures the monetary value that a customer brings to a business during their entire relationship (or lifetime) with that business.
Pro tip: Go here to learn how to calculate LTV.
Purchase frequency
Purchase frequency is the number of times a customer purchases from you within a set time period. Purchase frequency is an especially valuable metric for ecommerce businesses.
Monthly recurring revenue (MRR)
MRR tells you how much revenue from subscriptions or contracts you can expect each month. It’s especially important for subscription-based and SaaS companies because it measures the predictable, recurring revenue that these companies rely on, and serves as a strong indicator of financial health.
Experimentation metrics
When you run experiments, like A/B tests, there are a few metrics that will help you measure the impact and find the winner.
Conversion lift
Conversion lift shows you the percentage increase in conversion rate for a variation compared to the control group.
Statistical significance
Statistical significance tells you how confident you can be that your results aren’t likely due to random chance.
P-value
P-value measures the probability of seeing the observed data under the null hypothesis (that there is no difference between the groups) of a statistical test. In most business contexts, a p-value of less than 0.05 is considered statistically significant.
Confidence interval
The confidence interval is a range of values that likely contains the true conversion lift for a variation. For example, a 95% confidence interval of 2-5% means you can be 95% confident that the true conversion lift is somewhere between 2% and 5%.
How to choose the right metrics for your business
Tracking every single digital analytics metric will get overwhelming fast. It’s easy to drown in data if you don’t know what to look for or how to organize it. And different businesses will be focused on different metrics: a SaaS company will probably pay more attention to monthly or annual recurring revenue, while an ecommerce company will look closely at average order value (AOV).
Start by looking at your business objectives. What are the most important metrics for your business? What is your North Star metric? Working from the top down will help you determine the metrics that are most important to track.
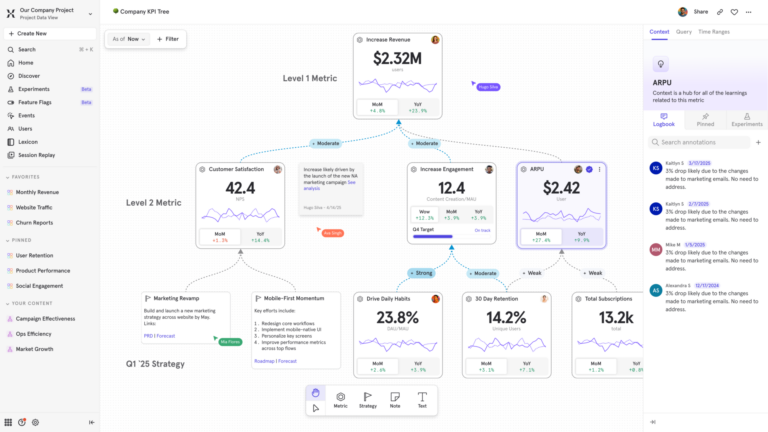
Pro tip: Use Metric Trees to operationalize your growth strategy.
Make sure you’re looking at actionable metrics over vanity metrics. Vanity metrics look good on paper, but they don’t drive decision-making, and they don’t give you a sense of a user’s value in a product.
Focus on metrics that give you meaningful insights—if this metric goes up or down, will that lead to more actions and different decisions? If not, it’s probably a vanity metric.
You’ll also want to balance leading and lagging indicator metrics. Leading indicators are predictive metrics that help you predict outcomes and spot potential opportunities. Lagging indicators measure past performance and help you understand and report on what has already happened.
Implementing digital analytics metrics effectively
To track, analyze, and gain insights from digital analytics metrics, you need to start with proper event tracking, so that you can understand how users are using your product. Event tracking makes it easier to capture and understand digital analytics metrics without outside support from your data team.
Different teams need to share a single source of truth when it comes to data, so that you know everyone is working from the same information. Features like Mirror mode sync for Warehouse Connectors ensure that your data warehouse is always up-to-date, automatically reflecting all changes, including updates, deletions, or additions.
Pro tip: Learn more about Mixpanel’s dashboard templates.
Turn metrics into action with Mixpanel
Mixpanel’s event-based, self-serve analytics powers faster decision-making. You can instantly track and analyze changes in important metrics, without writing SQL or relying on your data team to investigate.
Real-time dashboards give you instant insights into your metrics and product performance. Powerful features like Metric Trees help you connect user behavior to business outcomes, so you can understand how even low-level metrics impact overall performance.
Start tracking your digital analytics metrics today. Try Mixpanel for free.