


6 Signs you’ve outgrown your digital analytics tool

💡Insider tip: Reactive dashboards and data quality issues limit value more than may realize.
As a Mixpanel Solutions Engineer, I’m always looking for ways digital analytics can help our clients reach their business objectives.
My team and I guide companies at any stage who want to advance their analytics strategy and use the insights they gain to drive growth, break down silos, and understand how their actions impact not just their own KPIs, but their company objectives as a whole.
When companies mature, they often find themselves outgrowing their analytics. Google Analytics or a basic homegrown solution might have been enough to start with, but those options can rarely keep up with the demands of a data-driven company.
This might sound familiar. Maybe you’re struggling to find answers and wondering if you’ve outgrown your analytics. We’ve talked to hundreds of people in your position and helped them figure out how to graduate to the next level.
Here are five common signs you can use to identify when you’ve outgrown your analytics solution.
Sign 1: You're still waiting days for simple reports
It’s a typical Tuesday, and you’re in a team meeting trying to make a few routine product decisions. Here’s one, for example: “Should this icon in our app be red or blue?”
It’s a pretty simple question, which should be easy to answer by looking at the data. Unfortunately, you don’t have access to that data. So instead of making a quick decision in that meeting, you send a request for your data analysts to run a query.
By the time you get the report back a couple of days or weeks later, your team has already picked between blue or red at random (or based on a hunch—which, in a data-driven world, is the same as guessing) and moved on to other things. The feature had to launch, or the campaign needed to go live, and you couldn’t sit around waiting for answers.
If your data analysts are too busy and your request isn’t deemed high-priority, you might never get a report back at all.
Either way, you’ve lost an opportunity to make an informed, data-driven decision. When an organization is bottlenecked through a handful of folks who understand how to write SQL and operate complex BI tools, only the highest-priority analyses get timely responses.
No one should have to wait days or weeks for data.
The solution: Self-serve analytics
Self-service analytics platforms like Mixpanel allow you to make both micro and macro decisions based on clean, trustworthy, reliable data, without relying on analysts for help.
That sort of evidence-based decision-making compounds over time, whether it’s by ensuring that you’re allocating money to the right marketing campaigns or making the right product roadmap decisions.
Every single one of those decisions can and should be backed by real-time data. Using self-serve analytics makes that possible.
Sign 2: You're always questioning dashboards or reports
Imagine you’re in the same meeting as before, debating between blue and red, but this time, you pull up a report. It shows that blue is outperforming red. Clear winner, easy answer. Decision made, right?
Wrong. Someone else speaks up, pointing out that in their report, red is outperforming blue. Maybe your reports are using different sources, or maybe there’s an error. Either way, the result is the same: There’s a discrepancy, and now no one trusts the data.
These small moments of doubt add up, and together, they erode trust in your data. Eroding trust in data isn't just an inconvenience; it can lead to bad business decisions and an organizational culture that avoids data altogether. Put another way: it’s hard to encourage people to make data-driven decisions if the data isn’t clean, accessible, and reliable.
The solution: Data governance
Robust data governance ensures data quality, trustworthiness, and completeness. Mixpanel features like Lexicon allow you to standardize definitions and classify each event so that everyone speaks the same data language. Events can be verified and validated by the data team.
In addition, Warehouse Connectors allow you to pull data directly from the data warehouse into your digital analytics platform, so your data is up-to-date and centralized in a single source of truth. Mirror mode keeps that data synced by having the warehouse compute which rows have been inserted, modified, or deleted, and sending this list of changes to Mixpanel.
Knowing that you’re working with reliable, real-time data makes it easier to trust your dashboards and reports.
Sign 3: You're not learning enough from your session replays
Many UX, product, or marketing teams have access to qualitative data tools that are tailor-built for their role, offering things like session replay or heatmaps. Being able to see what real customers are doing and how they’re interacting with your website or product can be a powerful tool to deepen your understanding of the user experience.
Who has the time to watch thousands of hours of user sessions to find a single actionable insight?
Watching a few session replays here and there gives you an incomplete picture. At best, you’re learning a lot about how a specific person or set of people interacts with your product. At worst, you’re actually biasing yourself by pretending that this person’s session is indicative of the whole. They might be an outlier, or they might be part of one unique subset of users, or they might be a power user—there’s no way to know how their experience compares to everyone else’s.
The solution: Unified qualitative and quantitative data
Unifying your qualitative and quantitative data into a single digital analytics platform allows you to see high-quality data in real time.
For example, you see that a specific metric is trending up or down, and you want to understand why. You isolate a group of users who are performing well (or poorly, depending on what you want to learn), and then you filter and watch those sessions to get insights into their specific behaviors and experiences.
You might learn that a specific feature is broken on mobile, or that users coming from Facebook are more likely to churn, or any number of other things. You can learn not only what actions occurred, but also why they occurred. But you can only gain these kinds of insights by looking at quantitative and qualitative data together.
Pro tip: You can combine session replay and heatmaps without leaving Mixpanel—so you can see the "what" and the "why" without switching tools!
💡Learn more about Mobile Session Replay and the ability to watch replays for both front-end and back-end events using Server-Side-Stitching.
Sign 4: You're guessing how your metrics are impacting each other
Many companies struggle to break down silos. It’s hard for one team to understand how their efforts are impacting other teams. Each team has its own set of goals and KPIs that they’re working towards, and it’s often a little opaque within a company whether the efforts to improve those metrics in one place are having a negative impact somewhere else.
For example, a less-targeted marketing campaign might bring in more leads, but fewer of those leads convert, which impacts the product team.
Or even worse, one team’s actions may have positive effects on their own KPIs, but have a negative impact on overall business performance. This isn’t because people are incompetent or have ill intent. They just lack the complete picture.
The solution: Metric trees
Implementing a structured framework to visualize metric relationships helps you see not just when a number goes up or down, but also to understand these numbers in the context of your entire business.
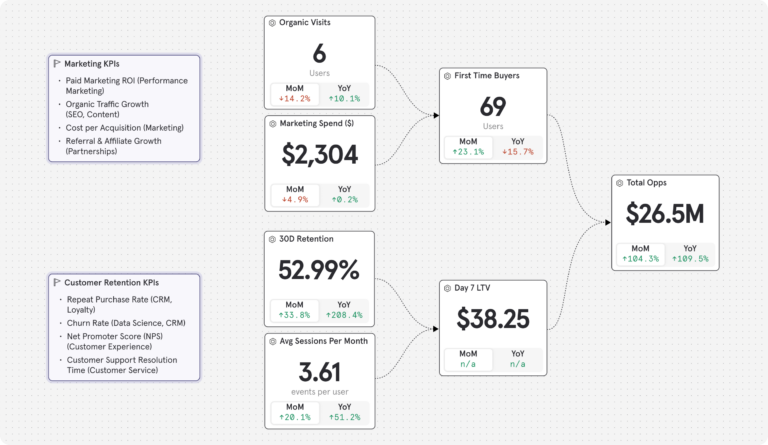
Metric trees allow companies to map all of their company metrics to their North Star metric and see how those metrics impact each other.
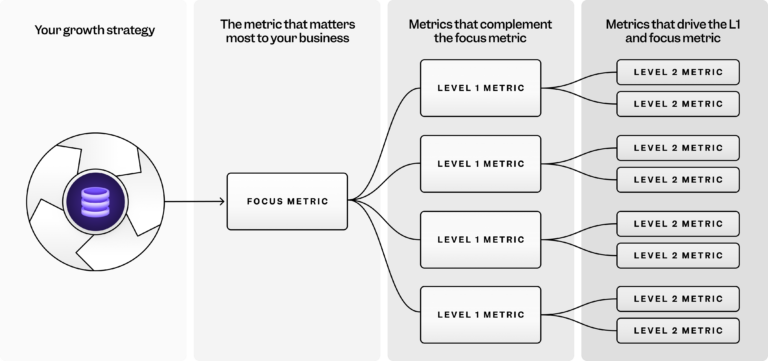
Let’s look at an ecommerce company as an example. For ecommerce, the North Star metric will probably be something like Average Order Value (AOV). With metric trees, you can map the work that the marketing team is doing to get signups and tie it to AOV. You can look at the work that the product team is doing to improve conversion rates along the purchase flow and see how those changes impact AOV.
Using a platform that allows you to build metric trees gives you visibility into how your actions are impacting your company. It’s very important for marketers, PMs, and growth managers, but also for execs who need to ensure strategic alignment and verify that everyone on their teams is driving the right business impact.
💡 Pro tip: See how you can operationalize your growth strategy with Mixpanel Metric Trees!
Sign 5: You don't get real (or helpful) results from A/B tests
You run A/B tests (including feature flags), but struggle to determine a clear "winner" or confidently explain why one variant performed better.
Revisiting “red vs. blue”
Let’s go back to that decision we were struggling with at the start—choosing between a blue or red icon.
You run an A/B test. Red gets 41%, and blue gets 40%. You look at the results and choose red. But this doesn’t give you any insights into why red won the test. And even more importantly, it doesn’t show the holistic impact of that decision on your other metrics. You have no way of knowing how users who chose red behave three or six months later.
- Do they churn?
- Do they stick around?
It’s a black box leading to frustration, wasted effort, and the inability to iterate effectively.
Making decisions based on these kinds of A/B tests prioritizes short-term wins over longer-term gains. They’re basically vanity metrics that look good on paper but don’t drive meaningful, long-term growth.
The solution: Experiments
Understand and measure the impact of your experiments with an analytics platform that can help you analyze the downstream behaviors influenced by each experiment.
With reports like Mixpanel Experiments, you can not only run the A/B test and control the feature flag targeted to a specific set of users, but you can also measure impact beyond that initial click to see how it affects retention, conversion rates, and long-term user experience.
You’re not making a decision based on the first number you see, but on a holistic view of user behavior.
Sign 6: Your product data is out of touch with your business data
Even data-driven companies struggle to break down silos. Your product usage data lives in separate tools from crucial business information like customer demographics, revenue, or marketing spend.
This limits your ability to connect what you’re seeing in the product to larger decisions happening in other places at your organization. When you attempt to make decisions, you lack access to all of the information, so you’re making a choice based on an incomplete picture.
The solution: Connected data
Integrating your digital analytics with your broader business data ecosystem helps break down silos and connect product data to broader business impact. The smoothest way to unify your data is to connect your data warehouse and your digital analytics platform. With unified data analytics, you can correlate a successful launch with marketing spend, for example, or understand how a product update decreased support tickets.
Example: Ad spend
With Google Ads, you can already see the CPC of every user who converted on your website. You use that information to understand how much you spent to acquire customers—if you spend $100 to acquire a user who only spends $30 on your business, you know you’re in trouble.
Ad platforms like Google Ads allow you to export that data to your warehouse. When you integrate the data in your warehouse into your digital analytics platform (with Warehouse Connectors, for example), you can gain additional insights and connect your ad spend data to revenue data.
With that information, you can go deeper. You might realize that your most successful campaigns (e.g., sign-ups are not actually the campaigns with the highest ROAS, and that a seemingly less successful campaign is actually attracting customers who spend more over time.
Advance your analytics
We often hear from our clients that they found us because another team at their company was already using Mixpanel. If your digital analytics setup isn’t satisfactory but you’re not sure what other options are available, talk to your colleagues. Chances are, they’ve gone through something similar.
Finally, advancing your analytics strategy isn’t just about the tech you choose. For a deeper dive into advancing your analytics mindset and practices, see our guide on Advancing Your Analytics Strategy or experience the Mixpanel difference today.