

Mixpanel earns 88 G2 badges in Summer 2026: A record quarter for customer recognition

G2 badges aren't analyst opinions. They're not vendor-submitted claims. Each one is awarded based on verified reviews from people who actually use the product, and G2 assigns them across dozens of category reports covering segment, region, and report type. The more a company's customers review it, and the higher they rate it, the more of those reports it qualifies for.
This summer, Mixpanel earned a record 88 badges across 214 tracked reports, marking our fifth consecutive quarter of badge growth. Our momentum continues to climb, up from 87 badges in Spring 2026 and 54 when we first started tracking in Summer 2025.
Five quarters, one direction
The headline number is 88 badges earned, but the more useful observation is the pattern behind it:
| Quarter | Total badges |
|---|---|
| Summer 2025 | 54 |
| Fall 2025 | 61 |
| Winter 2026 | 77 |
| Spring 2026 | 87 |
| Summer 2026 | 88 |
A 66% increase in five quarters, with growth every quarter. In a mature analytics category, that kind of compounding curve points to one thing: the product is meeting buyers where they are, and those buyers are willing to say so publicly.
Momentum Leader in all four categories, simultaneously
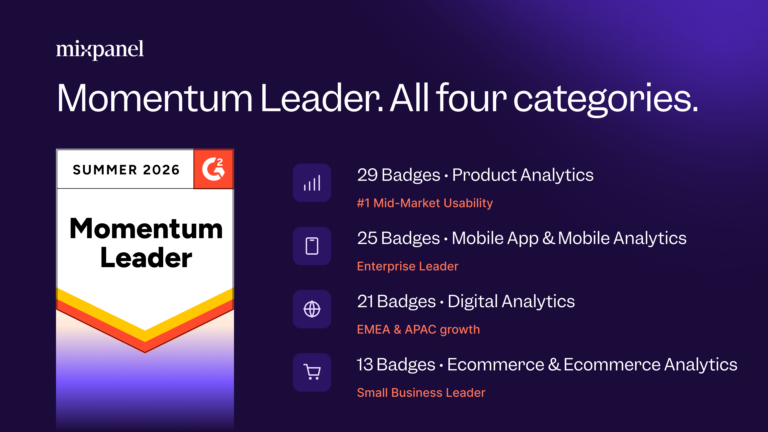
The defining signal from Summer 2026 is that Mixpanel earned the Momentum Leader sweep across Product Analytics, Ecommerce Analytics, Mobile App Analytics, and Digital Analytics, in the same quarter. Momentum badges are based on review velocity and satisfaction trajectory, not cumulative review count. Earning all four at once means Mixpanel ranks among the fastest-growing products by user satisfaction in every analytics category it competes in. Every one of those positions improved or held this quarter.
Product Analytics: 29 badges
Speed to insight is the question every product team asks during an analytics evaluation. A tool that requires a data engineer to pull every report gets abandoned six months in. PMs, analysts, and growth leads need to self-serve answers without queuing requests.
For the third consecutive quarter, Mixpanel holds #1 in Mid-Market Usability for Product Analytics on G2. That ranking is based on verified customer ratings and it's held across three separate review cycles.
Leader status this quarter spans every segment: Small-Business, Mid-Market, and Enterprise. Combined with the Momentum Leader position, Mixpanel is both the current leader and the fastest-growing product by satisfaction in this category.
The bottom line: Three consecutive quarters at #1 in Mid-Market Usability is the closest thing G2 produces to a sustained peer verdict on whether a product actually gets used.
Digital Analytics: 25 badges
Growth marketers and digital teams running live campaigns need analytics that move at the speed of their decisions. Batch reporting built for monthly reviews doesn't cut it when you're managing spend across channels in real time.
Digital Analytics earned Mixpanel 25 badge wins this quarter, including Mid-Market Leader and Momentum Leader. Leader positions span Small-Business and Mid-Market segments globally. The Momentum Leader position reflects review velocity from buyers actively choosing Mixpanel over alternatives, not a legacy install base holding a position it earned years ago.
The bottom line: Mid-Market Leader and Momentum Leader in the same quarter means Mixpanel is both the current choice and the accelerating one among digital analytics buyers.
Ecommerce Analytics: 13 badges
Real-time data isn't a differentiator in ecommerce anymore. Teams managing live inventory, dynamic pricing, and in-session personalization can't make decisions off yesterday's data.
Ecommerce Analytics earned 13 badge wins for Mixpanel, with Leader status across Small-Business, Mid-Market, and overall segments, plus Momentum Leader. That's every major segment covered, in a category where the baseline requirement is live event data without lag.
The bottom line: Leader across every segment plus Momentum Leader means ecommerce buyers at every company size are validating Mixpanel, and doing so at a faster rate.
Mobile App Analytics: 21 badges
For engineering leads and mobile product teams, the question isn't just whether a platform works for mobile. It's whether teams at scale are actually using it and recommending it. Small business adoption is easy to claim. Enterprise adoption requires a specific threshold of enterprise-tier reviewers signing off on G2.
For the Summer 2026 edition, Mixpanel earned 21 badge wins in Mobile App Analytics, including Leader status across all three segments (Small Business, Mid-Market, and Enterprise) plus Momentum Leader. The Enterprise Leader position means large-scale mobile teams have reviewed Mixpanel and recommended it. That's a different signal than small-business momentum alone.
The bottom line: Leader at every segment size, including Enterprise, means the scale question has a direct answer from the people actually running it.
Where the biggest moves happened: Regional breakdown
The category wins above reflect global signals. The data below shows where review growth is accelerating fastest and which markets have moved most over the past five quarters.
APAC: 31 badges, a regional record
APAC tied EMEA for the most badge wins of any region this quarter, and it's the strongest APAC performance Mixpanel has recorded to date. The movement in Product Analytics was particularly sharp:
| Market | Summer 2026 rank | Prior quarter |
|---|---|---|
| India Product Analytics | #2 | #4 |
| Asia Product Analytics | #2 | #5 |
| Asia Pacific Product Analytics | #3 | #5 |
| Mid-Market India Product Analytics | #2 | #3 |
Australia and New Zealand Product Analytics both hold Leader status at #3. Mid-Market Asia Pacific and Mid-Market Asia Product Analytics retain #2 positions held across multiple consecutive quarters.
Mobile App Analytics adds another layer of APAC depth. Small-Business India, Small-Business Asia, and Small-Business Asia Pacific Mobile App Analytics all earned Leader badges this quarter, driven by review velocity from teams building mobile-first products across those markets:
| Market | Summer 2026 rank |
|---|---|
| Small-Business India Mobile App Analytics | #3 |
| Small-Business Asia Mobile App Analytics | #4 |
| Small-Business Asia Pacific Mobile App Analytics | #4 |
In Digital Analytics, Small-Business Asia Pacific climbed from #15 to #10, and both the Asia and Asia Pacific Digital Analytics grids gained two positions and earned Leader recognition.
EMEA: 31 badges, and the Digital Analytics arc continues
EMEA matched APAC at 31 badge wins, spanning Product Analytics, Ecommerce Analytics, Mobile App Analytics, and Digital Analytics across the UK, Germany, Europe broadly, the Middle East, and Africa.
The Digital Analytics regional climb is the most sustained trajectory in the entire summer edition:
| Market | Summer 2026 rank | Spring 2025 rank | Lift since tracking began |
|---|---|---|---|
| Europe Digital Analytics | #8 | #32 | +24 positions |
| EMEA Digital Analytics | #9 | #31 | +22 positions |
| UK Digital Analytics | #12 | #22 | +10 positions |
Europe Digital Analytics moving from #32 to #8 over five quarters is especially significant as it’s compounding review growth from a specific market, reflecting real adoption among European digital teams.
Germany Product Analytics holds #2 for the second consecutive quarter, the same position it earned the first time it appeared on a G2 report in spring 2026. Mid-Market Europe, Mid-Market EMEA, Mid-Market Middle East & Africa, and Mid-Market Middle East Product Analytics all hold #2 in their regional grids.
In Mobile App Analytics, the EMEA grid moved to #6 with a Leader badge. Mid-Market EMEA and Mid-Market Europe Mobile App Analytics both hold at #3.
Americas: North American scale, Latin American growth
North America anchors the global Leader positions across categories. Canada Mobile App Analytics holds Leader status at #4. The Mid-Market Digital Analytics grid earned another Leader badge this quarter.
Latin America shows steady growth across both product and digital categories:
| Market | Summer 2026 rank |
|---|---|
| Small-Business LATAM Product Analytics | #3 |
| Mid-Market LATAM Digital Analytics | #5 |
What this moment means
Cookie deprecation reshaped attribution models. AI-driven analysis raised expectations for how fast answers should arrive. Real-time data became a baseline requirement for ecommerce and mobile teams. These shifts separated platforms built for the current environment from those still catching up.
Mixpanel accelerating across all four analytics categories simultaneously, while holding #1 in Mid-Market Usability for Product Analytics for three straight quarters, suggests the product direction is aligned with where buyers actually are. The G2 data comes directly from users who have no incentive to tell you anything but the truth.
See how Mixpanel stacks up across every analytics category.
G2 Summer 2026 badge data covers 214 tracked reports. Badge eligibility is determined by G2 based on review volume, recency, and satisfaction thresholds. Full methodology available at g2.com.