

After 10 years of turning knobs in Mixpanel, here’s why I’m all in on Headless

I've spent a decade helping companies answer hard questions about their users. A lot of that work took longer than it should have, because the only way to drive Mixpanel's query engine was through a UI.
Every project followed the same shape: Fire up the browser. Build a cohort. Build another cohort. Compose a formula. Re-check the filters. Screenshot the chart. Paste it into a deck. Repeat 50 times.
Mixpanel's infrastructure underneath could answer a hundred variants of the same question in seconds, but every variant still cost analysts their afternoon because the engine had no programmatic surface. Funnels are built, ad hoc, one at a time. Over time, I invented scrappy scripts to automate many of these tasks, a set of power tools for me and my colleagues to use. They were useful, but brittle.
Mixpanel Headless solves programmatic access to all of Mixpanel's capabilities. It's the full build. A typed Python SDK that exposes our entire product surface from code. And I believe an agent driving it can 10x the productivity of any analyst in your organization.
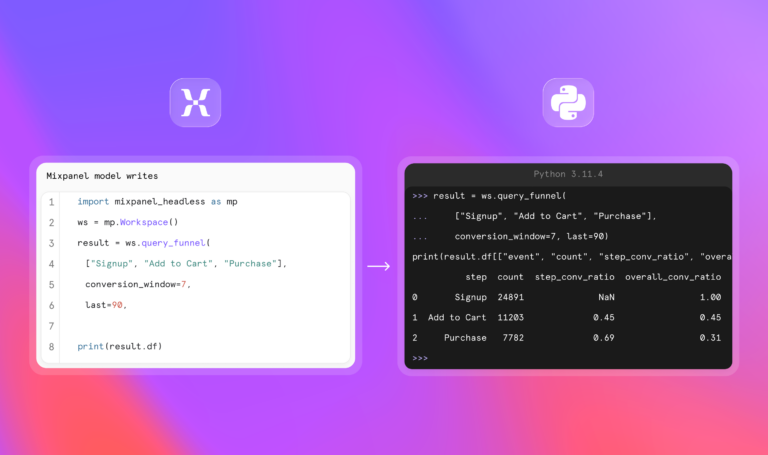
Headless doesn't mean "no brain." It means that you can put your own head on Mixpanel, utilizing our distributed query engine and all Mixpanel’s best ad-hoc analysis features from code. As I moved to operating via SDK, the implications were immediately apparent: By replacing tools with code, the sky was now the limit. Anything was possible! Instead of "calling" Mixpanel, I was "building" with Mixpanel. This frees product analytics in a way it's never been freed before. Let me explain.
The headless pattern
Developers know this word. Headless browsers (Puppeteer, Playwright) gave us automated testing and accelerated the pace of development. Headless CMS decoupled content from presentation and unlocked programmatic publishing. In each case, the same thing happened: stripping the UI layer exposed a programmatic surface that changed how we build. No UI means you can build beyond the capabilities of the UI.
Mixpanel Headless does the same thing for analytics. Every feature, every configuration, every query engine in our product, now accessible from code. What makes this moment different from previous headless waves is the audience. Headless browsers served developers. Headless CMS served content teams. Headless analytics serves everyone who has a hard question about their users, because the agent becomes the interface and “natural language” becomes the UI.
No UI means you can build beyond the capabilities of the UI.
The problem: Best features locked behind a UI
Mixpanel's most powerful features are the ones that enable product analytics at scale: Ad-hoc funnels with deeply configurable conversion qualifiers. Inline behavioral cohorts and cohorts as metrics. Custom properties with complex branching logic and spreadsheet-style formulas. Behavioral and multi-metric segmentation. Property borrowing and attribution modeling. Frequency distributions and custom bucketing. The most advanced retention suite available.
However, these features are also the ones that take the longest to learn and master.
I know this because I've built a career, over 10 years, learning how to use them. And I have watched dozens of teams struggle to get the most out of product analytics by failing to adopt these most valuable analysis features.
A few stories to illustrate this point:
- A fast food chain needed to clean up thousands of messy campaign names from their marketing platform. The names were brutal: categories mixed into strings, no consistent format, extreme high cardinality, and impossible to read on a chart. The solution was a custom property that stripped out the essential information with a regex and rendered it cleanly. It took hours to build in the UI. The customer loved it. Then they asked how long it would take their team to learn to do it themselves. Unfortunately, the answer was "too long."
- A well-known delivery service needed to compare behavioral rates across mobile and web. The raw session counts told one story: web dominated roughly 20-to-1. But when we built behavioral cohort comparisons with multi-metric formulas, we discovered that the mobile app converted at 13x the rate of web per session and drove over half of all orders from less than 8% of sessions. That insight was invisible at the surface. Pulling it out required exactly the kind of cohort breakdowns that live deep in Mixpanel's query builder.
- An eLearning app asked what sounds like a straightforward question: Do students who complete a course actually learn? How much do they learn per course? How can we measure that. Translating "do they learn?" into a query means behavioral cohort definitions, metric formulas, and filters that compose across multiple report types. You need to define what "learning" means behaviorally (completing exercises, scoring above a threshold, returning for another session), then compare those behavioral signals across course completions, and then control for how many courses each student has taken. Three layers of behavioral abstraction, all of which need to be composed correctly in a single query. The question that sounds simple on a whiteboard turns out to be complex in practice.
This is a pattern I've seen everywhere: The most simply-framed questions are usually the hardest to answer. In product analytics, the discipline of judging people's decisions by examining their events requires detailed analysis and complex joins. Often, the simpler (and less specific) a question is, the more analytical rigor is needed to define and quantify it. Building infrastructure to handle these queries on billions of events in a general-purpose data warehouse isn't trivial. It requires significant planning, pre-engineering, and it's definitely not ad hoc. This is what Mixpanel's distributed behavioral engine was built for.
And until now, you had to learn the UI to access it. Instead, Headless offers key benefits:
- Code mode improves analytical work vs. tool calling, which means greater efficiency and reduced cost.
- The SDK makes every query engine, governance tool, and management surface scriptable, meaning complex analysis is now quite simple.
- DataFrame outputs mean easy integration and interoperability with other systems.
Benefits of code mode
In 2025, Cloudflare published a post called "Code Mode". Their engineering team found that agents perform dramatically better when they write programs rather than call tools one by one through a tool-calling protocol like MCP (Model Context Protocol, the standard interface between AI agents and external services). Their insight was intuitive: Code is the language models already speak fluently, because they were trained on millions of open-source repositories. Tool calling is a synthetic surface invented by AI vendors. When you let the model write code, you let it work in its native medium.
Code is the language models already speak fluently.
Mixpanel Headless takes the same insight one step further. Cloudflare's code mode is still MCP underneath. Mixpanel Headless is a typed Python SDK with no MCP layer at all. Same insight, one fewer layer of indirection, full access to the Python data toolchain.
This distinction matters, so let me be precise.
- MCP is the right answer for tool-mode hosts: raw ChatGPT, raw Claude.ai, generalist agents that can't run code.
- Headless is better context engineering for deeper problems, like analytical deep-dives and ad hoc exploration.
The difference matters when the work is multi-step, math-heavy, and compositional.
Consider the asymmetry with a realistic example that most any business would have:
"What are the top five countries by purchase conversion among power users?"
In tool mode, every tool call is a model round-trip: list cohorts to find power users (round-trip), read the result and plan (round-trip), query sessions per country (round-trip), query purchases per country (round-trip), then divide and sort in its head (round-trip, and the model is bad at arithmetic). Five round-trips, two large JSON results eating context, and math done by an LLM.
In code mode: one program, one execution, math done by Python, only the final answer flows back to the model.
Every green box above on the tool mode side is a model round-trip with a JSON result eating context on the way back. Each blue box on the right is the program doing the work locally. Same question, dramatically different shape.
There's a subtler benefit, too. In code mode, intermediate results live in Python variables. Only the final answer (a print or a return value) flows back to the model's context. In tool mode, every intermediate result gets shoved back into the context window so the model can decide what to do next. On a five-step analytical task, that's five JSON blobs eating context for no reason. On a 50-step investigation, the context window collapses. Code mode keeps the intermediate state where it belongs, in the program.
Here's what that looks like for one of those enterprise questions I mentioned earlier.
A fintech app to help users with finance and budgeting may ask:
"Do users who set budgets actually save more money in our app?"
The response is 12 lines:
Do users who set budgets actually save more money in our app?
import mixpanel_headless as mp
from mixpanel_headless import Filter, Metric, CohortDefinition, CohortCriteria

ws = mp.Workspace()

budgeters = CohortDefinition(
    CohortCriteria.did_event("budget_created", at_least=1, within_days=90)
)

result = ws.query(
    [Metric("savings_deposit", math="sum", math_property="amount"),
    Metric("savings_deposit", math="unique")],
    formula="A / B",
    formula_label="avg savings per budgeter",
    where=Filter.in_cohort(budgeters, name="budgeters"),
    last=90,
)

print(result.df)
We're seeing a behavioral cohort defined inline (not saved in the UI first). Two metrics and a formula producing a single clean KPI. The cohort itself is used as the filter. And the result is a pandas DataFrame (a table you can manipulate in code, the universal format that every Python data tool supports).
The question is 12 words. The answer is 12 lines. One program, one execution, one answer.
The typed primitives are doing the heavy lifting here. Filter, Metric, CohortDefinition, CohortCriteria are reusable building blocks with defined shapes that compose across every query engine. Learn them once, and they work the same way in insights, funnels, retention, flows, and user queries. An agent reads these types the same way a developer does, but its context window is massive. The types tell it every query it can make and every pivot available. No documentation tab or "guessing" at JSON shapes. One Filter type works across five query engines. An MCP catalog would need a new schema for every primitive, and a tool agent would have to learn each one separately.
The question is 12 words. The answer is 12 lines.
Importantly, the model doesn't do math. Python does. The model doesn't orchestrate five tool calls across five round-trips. It writes one program. That's the headless difference.
Expansive analytics surface
I mentioned "every knob" in the title, and this is a key part of the release. Headless exposes the full Mixpanel product surface from code. Not a subset, not a query wrapper. Here are five capabilities that will surprise even longtime Mixpanel users:
- Five query engines: Insights, funnels, retention, flows, and user profiles. Every engine shares the same vocabulary of typed primitives.
- Full create, read, update, and delete actions (CRUD) for dashboards, cohorts, alerts, experiments, and feature flags: Build a dashboard, populate it with reports, share it with a team, and wire an alert to a metric threshold. All from a script.
- Lexicon governance: Hide stale events, tag them for review, annotate why they were hidden. Find every event that hasn't fired in 90 days and clean up your schema programmatically.
- Custom properties and custom events from code: That regex campaign cleanup that took a fast food restaurant hours in the UI? A few lines in Headless.
- Drop filters, lookup tables, and schema management: The governance layer that data teams rely on, now scriptable.
Headless ships as a Python SDK and a CLI. Same capabilities, two interfaces. This post focuses on the SDK because that's what agents use, but the CLI is there if you want to explore from your terminal.
Filter type works across all five engines. An MCP catalog would need a separate schema for each one.The DataFrame payoff
This is where the aperture widens.
Every query result from Headless is a pandas DataFrame. If you've worked with Python data tools, you already know what this means. If you haven't: A DataFrame is a table you can manipulate, transform, join, and export entirely in code. It's the format that every data tool on earth already speaks.
This changes two things.
- Mixpanel now plays with any visualization suite, any data science toolkit, any ML library. SciPy, Plotly, Streamlit, Jupyter, Polars. No connectors needed. No adapters. The result arrives ready to work with. Want to run a chi-square test on behavioral differences between two cohorts? The data is already in the right shape. Want to feed retention curves into a forecasting model? Same. No export step, no CSV download, no copy-paste into a spreadsheet.
- Mixpanel results can be written anywhere, in any format. Once you find something useful (an operational metric, a behavioral insight), you can have Headless be part of your data pipelines. Materialize aggregated, post-compute, post-query data anywhere. Build fully immersive web applications, APIs, or experiences with your organization's data, where Mixpanel solves the hard part: running distributed, expensive behavioral queries at scale.
A customer health dashboard that pulls retention curves, funnel conversion rates, and engagement metrics from Mixpanel, joins them against CRM data from your warehouse, and pushes a daily summary to Slack. An internal API that answers "how are our power users behaving this week?" by running a Headless query against live data and returning a structured response. These become straightforward when query results arrive as DataFrames.
The DataFrame is the bridge. It connects Mixpanel's bespoke query patterns on a distributed behavioral query engine to the rest of the data world. It changes how Mixpanel fits into your stack. And it changes your stack, because you can now do things with our query engine that were previously impossible, expensive, or fragile to do elsewhere.
Just as headless browsers changed what was possible in testing, headless analytics changes what's possible in data infrastructure.
Meet Mixpanelyst: Our first custom agent harness
Mixpanelyst is the first agent built on the Headless substrate, and the early results have validated this thesis.
Mixpanelyst is an analytical investigation agent that uses Headless as its primary query surface. You ask it a question in plain English, and it writes a Headless script to answer it. Behavioral cohort comparisons, campaign cleanup, pattern detection, and magic-number identification. These are the kinds of problems I've spent my career solving for customers. Questions that require deep knowledge of both the data and the tooling.
Building an agent that reliably answers analytical questions means knowing it actually got the right answer. So we built an eval harness before we built the agent. Running the model was the easy part. Generating realistic test data with verifiable answers was the hard part. Random rows from Faker won't do. You need data that behaves like real product data: power users who behave like power users, churn that has a reason, conversion funnels that drop off where real funnels drop off. Carl Sagan famously said, "If you wish to make an apple pie from scratch, you must first invent the universe."
So, internally, we did that. We made “the dungeon master” to generate exactly the kind of data needed to invent a universe (dataset) with deeply hidden trends. Dungeon Master encodes my 10 years of solutions engineering intuition into hooks: narrative levers that produce specific patterns in event data that we've seen for real customers:
- This segment binges content for three days and then drops off.
- This campaign converts 2x better on mobile than web.
- Users who hit the paywall on day 3 churn 40% of the time.
We created 200 narrative-based hooks across 20 different industry-specific datasets. Stories that manifest as funnels, retention, behavioral cohorts, formulas, and frequency distributions. All of them are inspired by real production findings from real customer engagements, all empirically verifiable, encoded in the data.
We know all the answers, root causes, and relationships within the trends because we planted them. But the agent didn’t know they were there. Can Mixpanelyst find the hooks with increasingly more “vague” prompts? That’s the challenge, and this was our eval harness for Mixpanelyst.
To give a concrete example from our eval sessions, one thing humans will rarely look for is binge-and-recovery patterns. Think of your favorite video streaming platform; a basic prompt from an end user might ask something like this:
“Do viewers who finish episode 1 in one sitting binge the rest of the season faster than viewers who watch it in chunks?”
The question cross-cuts funnels (do they progress through episodes 2, 3, 4?) and retention (do they come back next week to keep watching?). Building it in the UI means stitching three reports together by hand: a behavioral cohort to define what "binger" means, a funnel across episodes (holding the same show constant), and a retention curve.
In response to this question, Mixpanelyst writes a single script that does all of this in one program:
Do viewers who finish episode 1 in one sitting binge the rest of the season faster than viewers who watch it in chunks?
# behavioral cohort: finished episode 1 of a specific show in one sitting
bingers = CohortDefinition(
    CohortCriteria.did_event(
        "episode_completed",
        where=Filter.equals("show_id", "stranger_things_s4")
            & Filter.equals("episode_number", 1)
            & Filter.less_than("time_to_complete_min", 90),
    )
)

# funnel: hold show_id constant; users must progress through the SAME show
funnel = ws.query_funnel(
    ["episode_completed"] * 4, # nice :)
    where=Filter.in_cohort(bingers),
    holding_constant="show_id",
)

# retention: filter to the same show
retention = ws.query_retention(
    "episode_completed", "episode_completed",
    retention_unit="week",
    where=Filter.in_cohort(bingers)
        & Filter.equals("show_id", "stranger_things_s4"),
)

# run the same against the inverse cohort, join in pandas, compare
On binge-and-recovery, Mixpanelyst matched the planted ground-truth numbers to the penny. Across the full benchmark it scored above 88/100 on all five tests, with one coming back at 95. And binge-and-recovery is one of the 20 test patterns.
We ran the same harness runs across SaaS, ecommerce, fintech, media, and gaming verticals. Same architecture, different industry intuition encoded for each. No hints to the LLM. This is how we built our first general-purpose product analytics agent, with the full power of Mixpanel’s entire query engine. And Mixpanelyst is the starting point.
Because the SDK is whole, building specialized agents is small. We’re now iterating on specialized agents: dashboard experts, governance gurus, observability and monitoring guardians. Each of these is small to build because the SDK handles the hard part. The agent shape changes, the SDK doesn't.
This is the substrate argument: In a world without a typed SDK, every new agent requires designing a new tool catalog, writing new schemas, and hoping the model picks the right tool from a growing menu. With Headless, every new agent is a new skill on top of the same library. The SDK handles the depth and the agent handles the "personality". Our roster of agents is growing fast, because each new agent costs a fraction of the first.
If you'd like to meet Mixpanelyst, here's how to get started:
Mixpanelyst ships as a Claude Code plugin. Three commands from zero to your first question:
I want to try Mixpanelyst. How do I get started?
/plugin marketplace add mixpanel/mixpanel-headless
/plugin install mixpanel-headless@mixpanel-headless-marketplace
/mixpanel-headless:setup
The setup step installs Python dependencies and walks you through auth. After that, ask a question in plain English. "How many signups last week?" "Where do users drop off?" "Who are our power users?" Mixpanelyst writes the Headless script and runs it. Deterministic answers every time.
Prerequisites: Python 3.10+, Mixpanel credentials, full docs in the plugin README.
We're excited to introduce you to the rest of the cast very soon.
What this means
Let me circle back to where I started.
The point of Headless is to make expertise scalable, not obsolete. An individual analyst's instincts, encoded in code, running at the speed of an agent. That's the unlock of Mixpanel Headless. Expertise can now be distributed. The analyst who understands the data can now encode that understanding into a script that runs on demand, scaling to every question the organization has. No one needs to be "retrained" on a UI.
Anyone with a question can bolt their own head onto our engine and run it.
I've spent 10 years learning every checkbox, every filter, every formula builder in our product. I've learned them because they're powerful, and because customers needed someone who could translate their hardest questions into the right recipe of concepts to get the answer. Headless means that knowledge doesn't need to live in my head anymore. It lives in the SDK, typed and composable. Anyone with a question can bolt their own head onto our engine and run it. That's what I meant at the top by "put your own head on Mixpanel."
Your turn:
pip install mixpanel-headless
Connect your project. Ask your data the hardest question you can think of. You'll be amazed.