


What is a metric? The complete guide to measuring what matters most.

A metric is a quantifiable measure used to track performance. Metrics help you understand how your business or team is doing, and give you insights that help you make decisions and plan next steps. At its most simple, a metric is a number that matters for your business.
Most businesses are drowning in data but starving for insights. The problem isn't a lack of data—it's knowing which metrics deserve your attention and how to use them to drive growth, generate revenue, and deliver value to customers.
Too many companies are stuck in data purgatory, trying to figure out: What numbers do I need to track, and how do I measure them? What tools can I use? What are the markers of success for my industry?
The key to business growth is monitoring and tracking the right metrics—and using those insights to make data-informed decisions. Let’s take a look at what metrics are, important metrics for different industries, and how to choose the right metrics to track for your business.
What is a metric?
A metric is a quantifiable measure used to track performance. Metrics help you understand how your business or team is doing, and give you insights that help you make decisions and plan next steps.
At its most simple, a metric is a number that matters for your business.
Different teams have different priorities and will focus on different metrics: Product metrics help you measure product performance, marketing metrics measure marketing performance, financial or operational metrics give you indications of overall business performance, etc.
Metrics help measure how well your business is performing over time. When numbers like user retention or revenue go up or down, you can use that information to predict growth or troubleshoot potential problems. Metrics also help you benchmark your performance against other similar businesses in your industry.
Metric vs. KPI vs. event: What's the difference?
Metrics are made up of events, and some metrics (but not all metrics) are also KPIs. Not helpful? Let’s break it down...
When you use an events-based data structure (like Mixpanel does), events are the building blocks of your digital analytics. All events have an event name, a timestamp of when it occurred, and a distinct ID that ties it to a specific user. Events capture actions taken by your users on the most granular level: signed up, page viewed, or order completed are all examples of events that you can track.
Metrics are constructed from events. Once you know the metrics you want to measure, you define the events that will help you track those metrics.
For example, if you want to track the total number of users, you would look at:
new users + retained users - churned users
New users would be the event “account created” (for example), and churned users would be “account deleted.” Using events to track metrics makes it easier to build a tracking schema for your data.
KPIs (key performance indicators) are overarching metrics that are tied to specific business goals, guiding strategy and decision-making.
TL;DR: Events make up metrics, which roll up to KPIs.
How to construct a metric
As we mentioned above, events are the foundation of your metrics. Each event you track in Mixpanel has a timestamp and a unique ID. You can also add properties, which describe the event in more detail.
For example:
- A Page Viewed event might have a property called Page URL, which is set to the URL of the page that was viewed
- A Signed Up event might have a property called Signup Type, which indicates whether the signup was organic vs referral
- A Song Played event might have a property called Song Name, which is set to the name of the song that was played
You can also filter, break down, and aggregate your events by their properties to answer more questions, like which page users look at before visiting the pricing page, or which song is most popular among users.
In Mixpanel, you can also create Saved Metrics. Saved Metrics allow you to define key metrics (e.g., “Monthly Active Users,” “New Sign-Up”, or “Subscription Revenue”) once, and use them everywhere. That means everyone works from the same trusted source of truth—no more second guessing metrics or reinventing the wheel every time you open a new report in your analytics platform.

How to choose the right metrics for your business
The metrics that matter most for your business depend on a variety of factors: Industry, company size, and company type (SaaS metrics and ecommerce metrics are quite different, for example). The most important factor is to align metrics with business goals. Depending on your aim, metrics like customer retention and user engagement might take center stage. In other cases, you might focus more on conversions to paid or revenue metrics like average order value (AOV).
Retention metrics are particularly crucial since a 5% increase in customer retention can lead to a 25-95% increase in revenue. Key retention metrics include customer retention rate, churn rate, net promoter score (NPS), reactivation rate, repeat purchase rate, and time to value moments—all of which help you understand not just how many customers you're acquiring, but how many you're keeping long-term.
In any case, it’s important to focus on actionable metrics, where you can pull levers to increase (or decrease) the numbers you see. If a metric isn’t actionable (i.e., seeing that number go up or down doesn’t give you a next step to take), then it’s probably a vanity metric. Vanity metrics might look good on paper, but they don’t track actual business outcomes and create a false sense of success.
Here are some examples of important product management metrics across different industries:
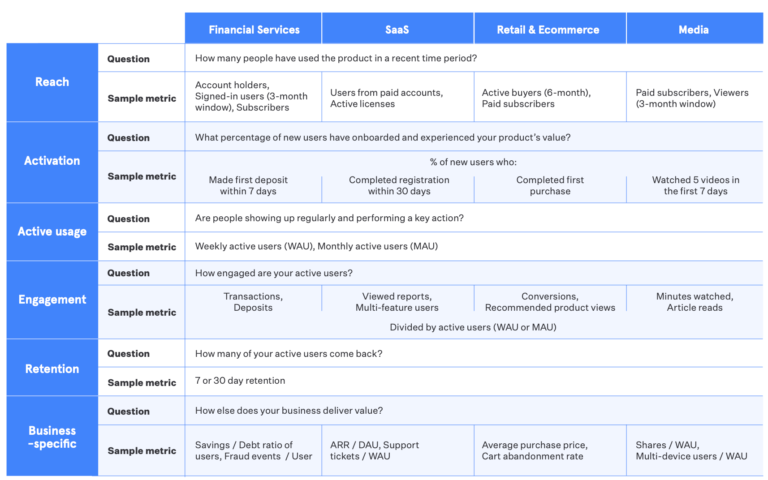
Keep in mind that each business will have its own “business-specific metrics” that depend on the type of business, the industry, and its own specific business model.
The North Star framework with metric trees
A North Star metric is the metric that is most predictive of a company’s long-term success. Organizations use it to bring different teams into alignment towards a common goal. Think of it as your destination on a map.
To qualify as a “North Star,” a metric must do three things: lead to revenue, reflect customer value, and measure progress. The theory is that if a metric does these three things and all teams are working toward improving that number, then the company will grow in a sustainable way.
Having a North Star metric as part of your metrics strategy is valuable because it tells you where you want to go. What it doesn’t tell you is how to get there. For that, you need to add metric trees.
Metric trees are the streets and pathways that help you navigate to your destination. Metric trees help visualize how all of your metrics relate to each other and drive impact, up to your North Star metric.
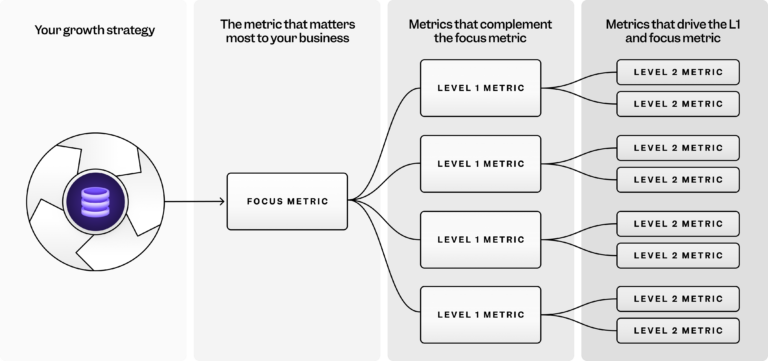
Metric trees also help you see when changing one metric will impact something else, which is especially important for cross-team collaboration. You want your product team to know if product changes are leading to an increase in customer support tickets, for example. Or if your marketing campaign correlates with a decrease in conversions down the line, that’s worth noting. Metric trees give you access to those insights in a way that’s clear and easy to understand.
💡 Pro tip: See how you can operationalize your growth strategy with Mixpanel Metric Trees!
Essential metrics by business type
As we mentioned above, different types of businesses will place importance on different metrics.
For SaaS and subscription-based companies, retaining customers and increasing their lifetime relationship with the business is crucial to profit. Metrics like MRR and ARR (monthly and annual recurring revenue), LTV (customer lifetime value), and CAC (customer acquisition cost) will be top priorities, along with values like retention and churn rate.
Ecommerce businesses will focus on metrics like AOV (average order value), abandoned cart rate, returning customer rate (how many customers return to make another purchase), and purchase frequency, along with LTV and CAC.
Mobile app companies prioritize engagement metrics like daily active users (DAU), session length, and app store ratings, alongside retention metrics such as day-1, day-7, and day-30 retention rates. Push notification open rates and in-app purchase conversion rates are also critical for mobile app monetization and user engagement strategies.
Not sure what to track? Check out the top 21 metrics for startups or nine user onboarding metrics to help you get started.
Get what you need to start tracking and analyzing metrics
Knowing what metrics to track is an important first step, but it won’t help if you don’t have the right solutions in place to do so.
Self-serve analytics platforms like Mixpanel democratize access to your data by enabling everyone on your team to track metrics and analyze your data. Self-serve solutions eliminate delays and bottlenecks waiting for responses from data analysts.
Start tracking your most important metrics in Mixpanel—get started free.