

DRAB: Why boring analytics strategies scale the best

Last year, I got the chance to transform how data and analytics works at the world's largest streaming platform.
JioHotstar has 450 million monthly active users. At peak—the ICC World Cup final—72.5 million people watched at the exact same moment. What that scale tends to create analytically is a specific kind of chaos. Every team measures differently. Every leader wants their own view. Definitions drift until the same question yields three different answers depending on who you ask.
My instinct was that the solution wasn't more tooling, more dashboards, or more analysts. To squash the drama around our data, we needed discipline—boring, unglamorous, organizational discipline. It’s the kind of effort that most analytics teams resist because it feels like pointless overhead rather than output. But what emerged from that conviction is a transformational framework we built across four areas.
We call it DRAB.
The dashboard graveyard
Drab, by dictionary definition, is dull, boring, lacking in color, variety, and excitement. We named it that deliberately.
At our scale, fragmentation is the default outcome when data grows faster than governance. Without discipline, you get what I think of as the dashboard graveyard: hundreds of stale dashboards, conflicting metric definitions, pipelines that have quietly gone stale, and a slow erosion of trust in the numbers. Fragmentation is a quiet killer of organizational speed and single-source truth.
DRAB is the intervention. There are four components, each targeting a specific failure mode.
- D — Dashboards: A shared map
- R — Reusable components: One language across teams
- A — Automations: Insights that find us
- B — Bots: Answers, not queries
D—Dashboards: A shared map
When I joined, different dashboards showed different numbers and three separate teams would give three slightly different numbers.
The fix was structure. We stopped allowing dashboard proliferation and instead created three distinct types, each designed for a specific audience.
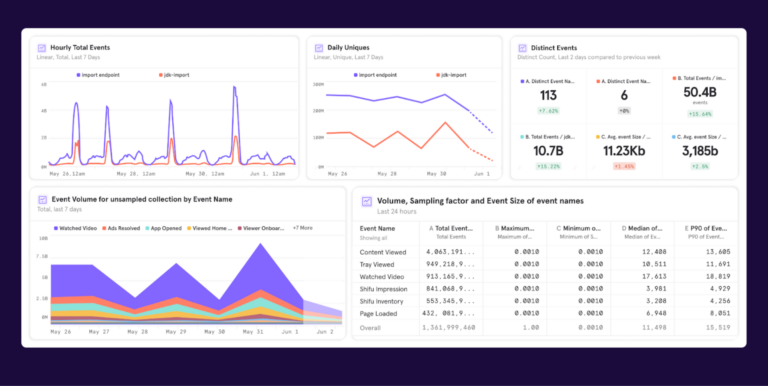
Exec boards are focused on high-level North Stars: daily active users, global watch time, paid conversions, and core business churn. We've also blended in light machine learning—mid-month forecasts showing how annual operating plan metrics are trending by month-end. Executives get the heartbeat without the noise.
Squad boards are specific to each product pod: the recommendation system team, the search team, the player performance team, the checkout team.
Event boards are temporary, built exclusively for live events—IPL, World Cup, major film launches. They spin up fast and shut down when the event is over.
The moment these boards came online, during the cricket World Cup, is one I won't forget. Early in the tournament, I was still in the old world, firing off real-time queries and relaying numbers through three levels of management. By February, I was watching matches on the big screen with my Mixpanel dashboards open on my laptop—texting my bosses. The moment we crossed 65 million concurrent viewers, I sent the message before it was announced anywhere. When we hit 72.5 million in the final, I texted before the broadcast confirmed it.
One of my leaders said to me afterward: "For 12 years, I was asking and getting inconsistent information. Today, without asking, I'm getting right information." That's the shift.
Those dashboards also gave us something operationally critical: real-time content delivery network (CDN) visibility. As a match progresses, we can track delivery network performance and rebalance supply across providers. We triggered three live interventions during the World Cup final, including a mid-match CDN reweighting that protected millions of stream sessions.
R—Reusable components: One language across teams
The second failure mode was definitional drift. When I joined, the “meaningful watch” metric had three legitimate definitions: 30 seconds (you didn't click by accident), ten minutes (you saw an ad), or one minute (the broadcast standard). Three definitions, three numbers, no clear truth.
There's a saying: Torture data enough and it'll confess to whatever truth you want it to tell. The only protection is a central, neutral team that owns definitions. But that creates its own problem: You can't democratize anything if everything has to flow through a bottleneck.
Reusable components in Mixpanel solved both sides.
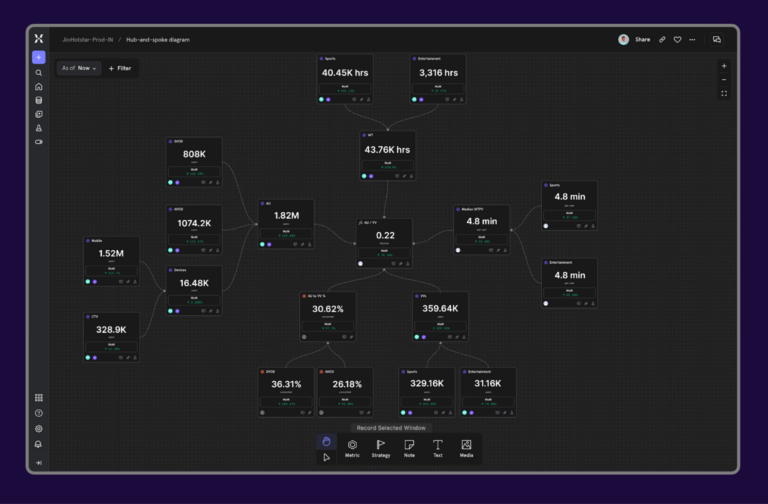
Lexicon is our single source of truth for event names, definitions, and ownership. The moment a definition is set by the central team, it's the definition. No team rolls their own version of a standard event.
Saved behaviors are standardized equations for complex logic. "Quality Playback Session" means the video started playing within X seconds, and buffering stayed below Y percent during playback. Saved once, shared everywhere, always the same answer.
Shared cohorts are central segments—"entertainment-heavy viewer," "lapsed cricket fan"—computed once and consumed across product, growth, and operations. Now it's standard, which means we can ask real questions like, “How many primarily sports viewers watched entertainment for the first time during IPL?”
The proof showed up in a comparison with our previous tooling. For a while, we ran Mixpanel alongside other analytics solutions. The non-Mixpanel numbers would drift in ways teams couldn't explain, and the refrain became "we don't believe this data." We've never had that with Mixpanel. That reliability is what makes shared components trustworthy enough to actually share.
Today, we have essentially no arguments over data in meetings. That outcome alone is worth the governance investment.
A—Automations: Insights that find us
Here's an honest confession: I loved manually texting my leadership during cricket matches for the first five games. Then I got bored.
I had built something valuable—real-time match intelligence reaching the people who needed it—but I was the bottleneck. So we automated it.
We wrote a program that pings the Mixpanel API at regular intervals, pulls the data, formats it, and sends it via email and directly to my bosses' WhatsApp. The messages go out without me now. I can just watch the cricket.
What goes out is richer, too. We added real-time win probability—because viewer metrics are highly correlated with match tension. When it's a one-sided game, people leave. The automated update includes a probability bar that puts viewership in context, not just as a raw number.
The same infrastructure powers subscription decisions. We can identify viewers hitting their free-watch limits during high-attention moments and serve personalized paywall messages in real time. When a star batter steps in and five million people tune in just to watch him—and five million leave when he's out—that signal is actionable. During one match, Rohit Sharma played a quick-fire innings before picking up an injury. In 30 minutes of batting, we sold around hundreds of thousands of subscriptions.
That's what automations unlock: not just faster reporting, but faster decisions.
B—Bots: Answers, not queries
We didn't want to scale by hiring hundreds of analysts. The model we're building: a lean group of expert engineers, and over 500 business owners querying the system autonomously.
For that to work, we needed a governance layer—only people with access to certain data can query it—and intelligent routing across our Databricks installation, Tableau dashboards, and Mixpanel. We began using Mixpanel Agent powered by Context Engine, and it sits on top of all of that, surfacing answers inside the tools teams already use.
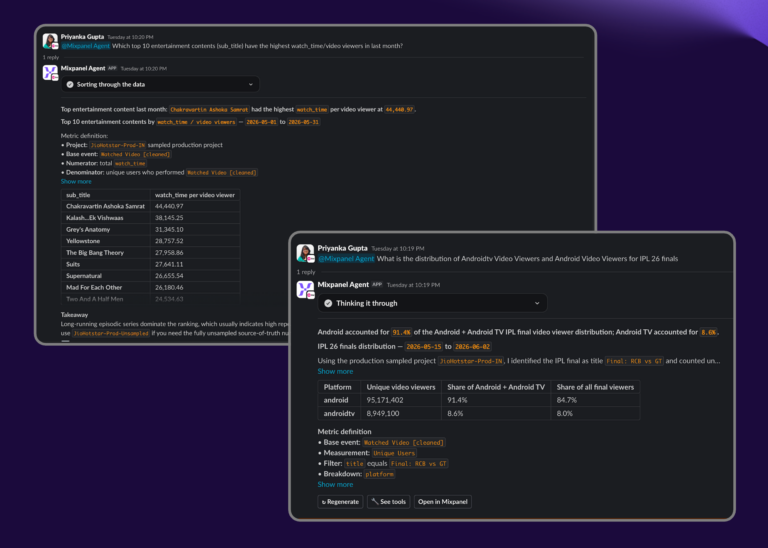
A recent example: We launched a major new Indian film—the largest ad campaign we'd ever booked. The teams needed real-time intelligence: Are advertiser budgets burning as committed? How are subscriptions tracking? What's the watch time per viewer, and how's the engagement curve? The Mixpanel Agent handled that entire question surface, providing all the answers without needing to be persistently prompted.
Our DRAB analytics strategy is still driving enthusiasm and Mixpanel adoption among our human team members, but it wouldn’t be possible to scale our processes as fast as we are without agentic, context-aware support.
Drama is expensive
DRAB isn't modest. It's disciplined.
Dashboards give us a shared map. Reusable components stop the metric wars. Automations make insights find us. Bots democratize the query. Each one addresses a specific way that analytics at scale falls apart when left undisciplined.
What made the transformation possible wasn't technology—it was the willingness to impose structure on a system that had grown chaotic. For 12 years, leadership was asking questions and getting inconsistent answers. Today, they get the right information before they ask.
At our scale, drama is expensive. DRAB is the strategy.