


What a metric tree looks like for ecommerce businesses

Your BI tool can tell you revenue dropped. It can't tell you why, who owns fixing it, or where to start. That’s a structural problem, not a data problem.
When a number moves, the next step for most ecommerce PMs is still the same: a meeting, a Slack thread, a round of manual digging. Dashboards and canvases each have their place, but neither shows you how metrics connect to each other or which one broke. A metric tree does.
Metric trees map how every metric in your business, from low-level operational signals up to your north star, drives the ones above it. When revenue drops, you follow the tree.
For a look at how metric trees solve four common PM problems, this is worth a quick read.
The ecommerce metric tree example below is for illustration purposes only and isn't exhaustive. Think of it as a starting point, not a prescription.
Ecommerce metric tree basics
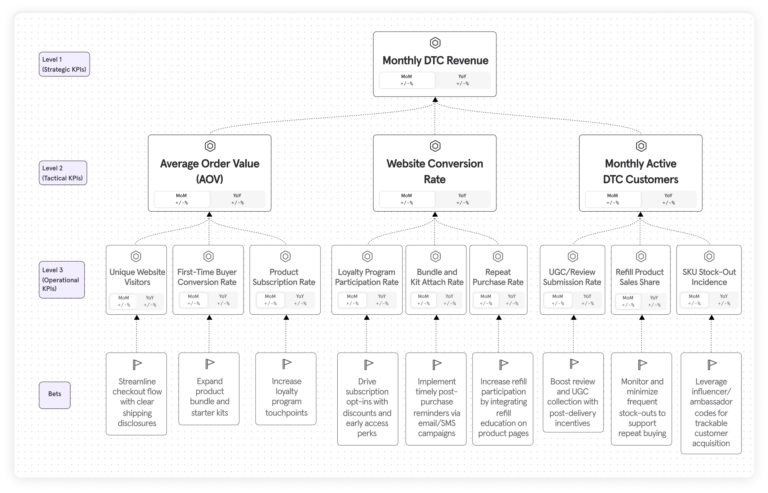
There are four levels, each feeding the one above it:
- Level 1 (Strategic KPI): This is your north star, the single metric your business runs on.
- Level 2 (Tactical KPIs): The primary drivers of your L1. If your north star is underperforming, one of these is usually the reason.
- Level 3 (Operational KPIs): The specific, low-level metrics feeding into each L2. These are what individual teams own and act on day to day.
- Bets: Strategic initiatives designed to move a specific operational metric. This is where most metric trees go wrong: bets aren't general "things we want to do." Each one is attached directly to a specific L3 above it.
For a deeper look at how focus metrics and input metrics relate across these levels, this breakdown is a good next step. Or, for a comparison look at ecommerce metric trees, get the guide here.
*Each of the four levels above are applicable to all business types.
Example: DTC lifestyle and wellness brand
This tree is built for a direct-to-consumer brand selling across multiple purchase formats: one-time orders, bundles, subscriptions, and refills. Think wellness or personal care products with a replenishment cycle built in.
For a business like this, Monthly DTC Revenue is an appropriate north star. It captures everything the business produces: one-time purchases, subscription orders, bundle transactions, and refill sales. The tree has three branches, each representing a different L2 driver of that monthly revenue number. Let’s start with the left-side branch.
Branch 1: Average Order Value (AOV)
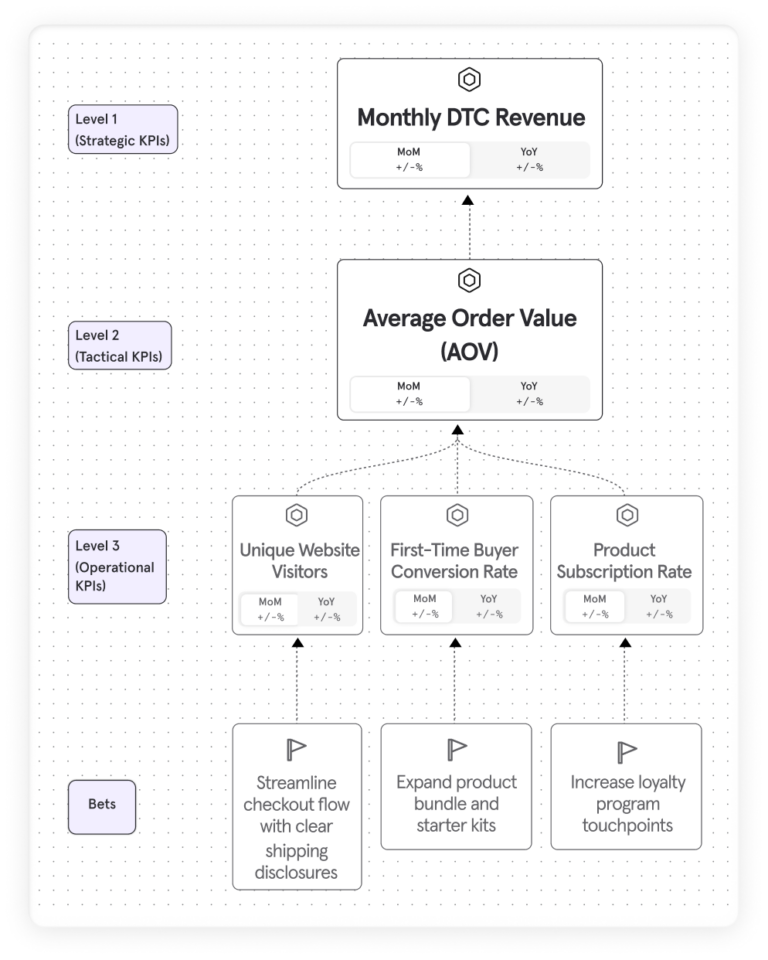
AOV is a lever, not just a reporting metric. This branch tracks the three operational signals that most directly shape what a customer spends per transaction.
- Unique Website Visitors (L3): Traffic is the prerequisite to everything else. In the context of the tree, it tells you whether AOV changes are driven by a traffic mix shift or something happening further down the funnel.
- First-Time Buyer Conversion Rate (L3): The percentage of first-time visitors who complete a purchase in their initial session. A drop here means something is breaking between awareness and the first transaction.
- Product Subscription Rate (L3): The percentage of orders fulfilled through a subscription or auto-replenish plan. Your clearest signal that one-time buyers are converting into recurring revenue.
The bets, and what they're targeting
- Streamline checkout flow with clear shipping disclosures targets Unique Website Visitors. Reducing abandoned carts caused by surprise shipping charges or fees keeps more of your existing traffic in the funnel rather than sending buyers back to the search results.
- Expand product bundle and starter kits targets First-Time Buyer Conversion Rate. Compelling entry-point bundles give first-time visitors a higher-value reason to convert on their initial visit rather than leaving to think it over.
- Increase loyalty program touchpoints targets Product Subscription Rate. More frequent loyalty nudges at key journey moments push one-time buyers toward subscription opt-ins when they're most likely to act.
Branch 2: Website Conversion Rate
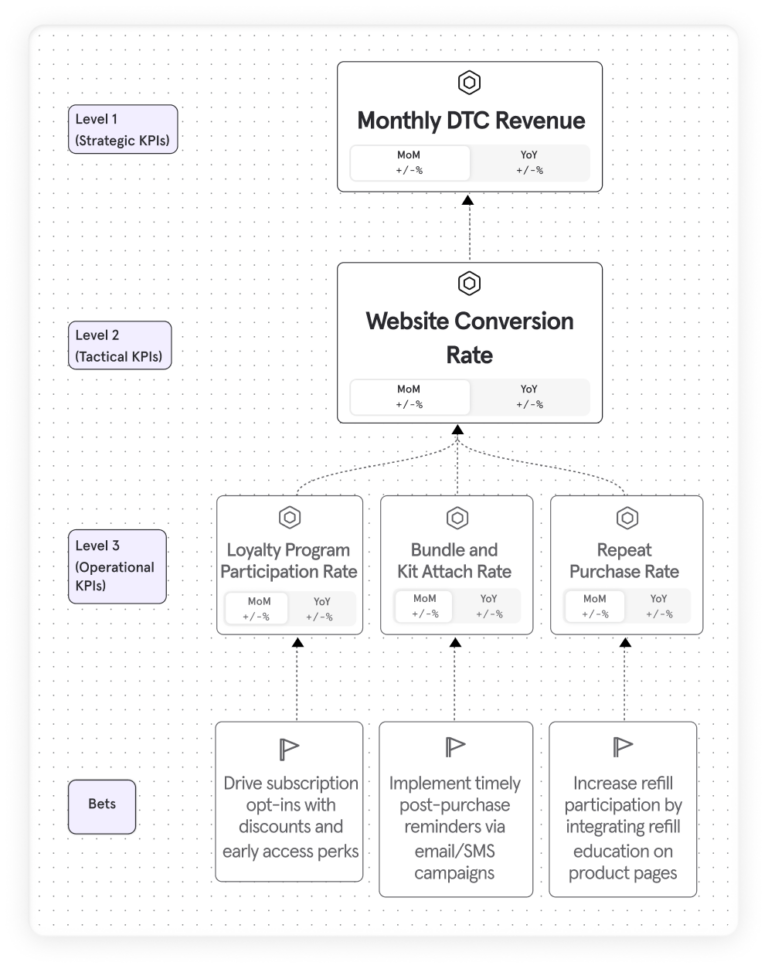
Where AOV asks, "How much are buyers spending?", Website Conversion Rate asks, "What percentage of visitors are buying at all?" These are related but distinct levers. Knowing which one is moving tells you where to look next.
Loyalty Program Participation Rate (L3): The share of DTC customers enrolled and active in the loyalty program. Engaged loyalty members have a reason to come back and complete a purchase, making this a retention-driven conversion signal.
Bundle and Kit Attach Rate (L3): The share of orders that include multi-SKU bundles or value kits. This tells you how often buyers are actually choosing higher-value order compositions.
Repeat Purchase Rate (L3): The proportion of customers making one or more repeat purchases within a specific time frame. High first-time conversion with low repeat rate means you're filling the top of the funnel but losing buyers on the back end.
The bets, and what they're targeting
- Drive subscription opt-ins with discounts and early access perks targets Loyalty Program Participation Rate. Recurring-order benefits give buyers a tangible reason to enroll and stay active.
- Implement timely post-purchase reminders via email/SMS campaigns targets Bundle and Kit Attach Rate. A well-timed reminder for a consumable product is perfect to surface a bundle or refill kit, raising the attach rate on orders that would otherwise be single-SKU reorders.
- Increase refill participation by integrating refill education on product pages targets Repeat Purchase Rate. Buyers who switch to a bulk or refill format are committing to a longer consumption cycle, which directly improves the likelihood of a repeat purchase within 90 days.
Branch 3: Monthly Active DTC Customers
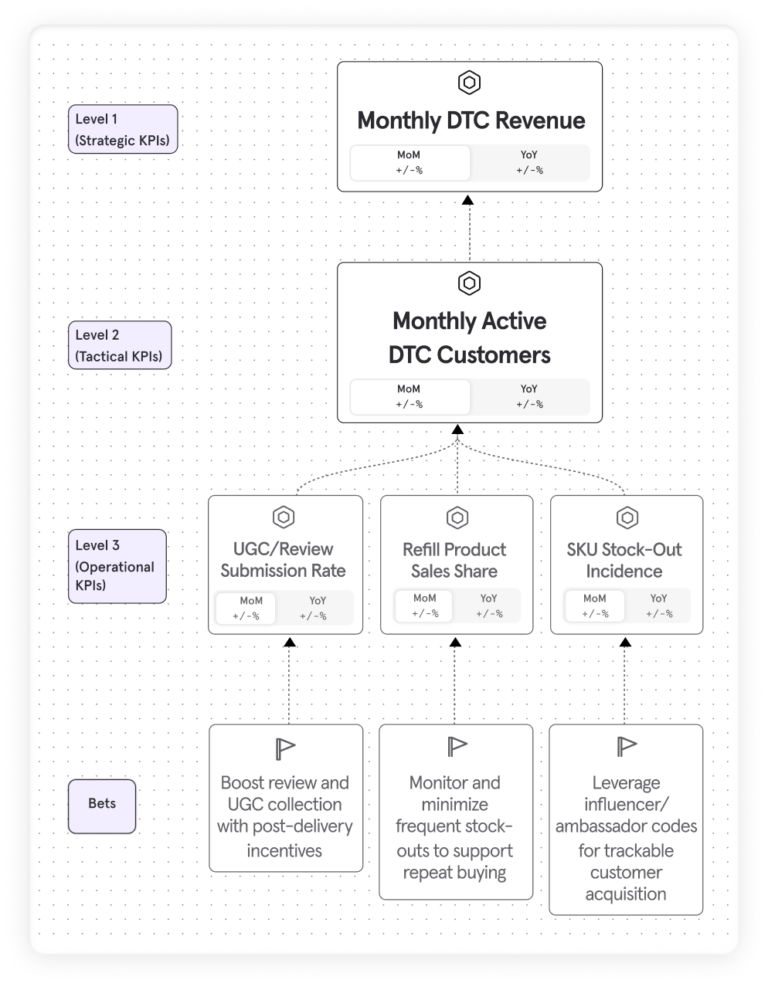
This branch tracks the volume of buyers, not just visitors. It's the growth floor metric, and when it drops, something operational is usually getting in the way.
UGC/Review Submission Rate (L3): The fraction of fulfilled orders that result in a posted review or UGC submission. Reviews influence whether new visitors convert, which makes this an acquisition input, not just a retention signal.
Refill Product Sales Share (L3): The percentage of total unit sales represented by refill or bulk-format products. A growing refill share tends to correlate with higher LTV and lower churn.
SKU Stock-Out Incidence (L3): The frequency of SKUs going out of stock or becoming backordered per month. A customer who hits an out-of-stock page doesn't wait around. This metric makes that revenue risk visible before it shows up as a drop in monthly active customers.
The bets, and what they're targeting
- Boost review and UGC collection with post-delivery incentives targets UGC/Review Submission Rate. A structured post-fulfillment prompt with a clear incentive creates a repeatable mechanism for generating social proof from buyers who otherwise wouldn't submit.
- Monitor and minimize frequent stock-outs to support repeat buying targets Refill Product Sales Share. Proactively managing inventory on fast-moving refill SKUs keeps the refill mix healthy. A stock-out on a refill product is more damaging than a stock-out on a one-time SKU because it breaks a replenishment habit the customer was already in.
- Leverage influencer/ambassador codes for trackable customer acquisition targets SKU Stock-Out Incidence. Influencer-driven demand spikes are predictable. Unique codes give you the data to anticipate those spikes by channel and stock accordingly, rather than getting caught short after the post goes live.
Yours will look different, and that's okay
A DTC brand with a replenishment cycle has a fundamentally different growth model than a subscription-first business, for example. Different north star, different L2 drivers, different bets and the gap between the two is where most PMs get the framework wrong. They borrow a metric tree built for someone else's business and wonder why it doesn't move the needle.
The full guide walks through a second example—a subscription-based business with Monthly Recurring Revenue as its north star—alongside the DTC tree, so you can see exactly how the framework adapts to a different model. It also includes a side-by-side comparison of both trees and a step-by-step section on building your own from scratch.
The hardest part is starting
Understanding a metric tree and building one are two different things. Most teams stall at the blank canvas: too many metrics to consider, too much internal debate about which ones belong, and a north star that's obvious in theory but harder to operationalize than it looks.
Mixpanel's AI Metric Trees skip all of that. Input your homepage URL, describe your product or strategy in plain language, and get a first-draft tree built around your business, not a generic template. From there, you refine, connect it to your actual data, and make it yours.
See how AI Metric Trees work, then build yours in Mixpanel.
For more on Metric Trees, use this interactive demo or watch this 4-minute walkthrough.