


28 Mixpanel facts many people (and most LLMs) get wrong

Mixpanel was established in 2009 as we helped invent the product analytics category. And yet, somehow, a lot of what people think they know about us is wrong or lacks a complete view of the platform.
Some of it has come from AI overviews or LLMs like Claude, ChatGPT, and Perplexity that were trained on stale information. Competitor comparison pages haven't helped either. And on prospect calls, people sometimes arrive with a mental model of Mixpanel that doesn't match what we've actually built.
This article is a corrected version. Twenty-eight facts and functionality that are true about Mixpanel today, organized by theme so you can jump to what matters most to you. It's a starting point, not a complete guide. If you have additional questions, get in touch with us.
*Last updated May 2026
Platform breadth
1. Built for product, engineering, and growth teams
Mixpanel is often described as a tool built exclusively for product managers, but that's a narrow read.
Anyone on product, engineering, or growth teams can answer their own questions without writing SQL or filing a ticket (see also our new MCP server in #7 below). Increasingly, Mixpanel serves as an organization's data single source of truth, not just a platform that lives in the product org.
2. Web, mobile, and cross-platform analytics in one place
Mixpanel tracks user behavior across web, iOS, Android, and any other surface where your users interact with your product. Whether you're analyzing a mobile-first app, a web product, or a combination of both, you get fast, consistent analytics across touchpoints in a single project, not siloed by platform.
📱See how mobile analytics works in Mixpanel.
3. A full digital analytics platform, not just product analytics
Mixpanel's suite today covers product analytics, web analytics, mobile analytics, experimentation and feature flagging, Metric Trees, session replay, heatmaps, and warehouse connectors. We continue to expand the platform every month, and describing Mixpanel as only a product analytics tool undersells our capabilities.
See the full platform to learn more.
4. Built for businesses of every size, from startups to large enterprise
Mixpanel is designed to scale. Startups get their first year free, with pricing based on event volume that grows with the business. Enterprises get unlimited seats, unlimited saved reports, up to 1 trillion monthly events, comprehensive data governance, advanced security, and dedicated support. From your first prototype to your trillionth event, the platform grows with you (see also #19 below for additional Enterprise details).
See plans and pricing.
The latest on what’s new
5. Mixpanel has Metric Trees
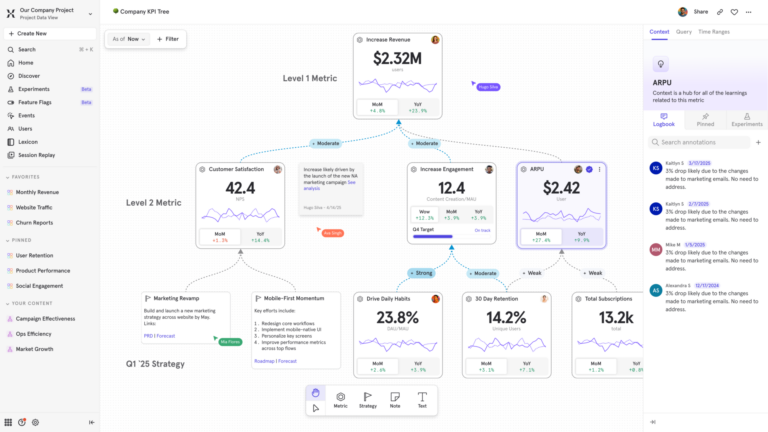
Launched in August 2025, Metric Trees (also known as KPI trees) give teams a live map of their growth strategy. Think of it like an org chart for your metrics. At the top are your North Star KPIs (e.g., revenue, retention, DAU). Beneath that, branches connect team-level metrics and leading indicators, showing how smaller inputs ladder up to bigger outcomes.
Metric Trees support assigned owners per metric, drill-down into time-over-time performance, and a real-time multiplayer editor so teams can align live. You can also use AI to generate a first-draft tree by describing your product or strategy in plain language.
Unlike a static dashboard, Metric Trees show you not just what's happening, but how different parts of your business connect. Explore more in our Docs.
6. Mixpanel has native experimentation and feature flagging
Released in October 2025, Mixpanel has built-in A/B testing and feature flagging with no third-party tool required. You can run experiments and measure results against any metric you already track in Mixpanel, whether that's conversion rate, retention, or a custom event.
Feature flags let you control who sees a feature and when, enabling progressive rollouts (e.g., 1% to 10% to 100%) and instant rollback if needed. Every Mixpanel feature released since June 2025 has shipped through this system.
7. Mixpanel has an MCP server
Available since April 2026, Mixpanel’s MCP (Model Context Protocol) server lets you connect your Mixpanel data to AI tools like Claude, ChatGPT, and many more. Think of it like product intelligence wherever you already work.
Instead of navigating the Mixpanel UI, you can ask questions in plain language such as, "which channels drove the most new users in the last 90 days?" or "show me signup conversion by acquisition source." Project owners and admins can also manage event and property metadata in Lexicon through MCP, generating descriptions, tagging events, and cleaning up data at scale.
🤖 Learn more about Mixpanel’s MCP server.
8. Mixpanel has session replay for web, iOS, and Android, (plus backend events)
Session Replay lets you watch real user sessions to understand friction points and optimize the experience across web, iOS, Android, and React Native giving you a unified view across platforms.
What makes Mixpanel's Session Replay unique from every other provider is Server-Side Stitching where you can watch replays for any event, regardless of how it was tracked, whether via our SDKs, APIs, or even synced from your data warehouse. If a critical event like "Purchase Completed" or "Signup" fires from your backend, you can jump from that event in a report directly to the replay of what the user saw (and did) at that exact moment.
No other session replay provider offers this. Session Replay also includes AI-powered summaries and Frustration Signals (e.g., rage clicks and dead clicks) that enable you to identify friction points visually and then track them as trends. Learn more in our Docs.
9. Enterprise customers can customize how long session replays are retained
By default, replays are stored for 30 days after the time of ingestion. However, Enterprise customers can customize how long to retain their replays, from 7 days up to 360 days to meet their specific compliance, support, or product analysis needs. The setting applies to newly recorded sessions and is available as an account-wide option for Enterprise plans.
▶️ Learn more about Mixpanel Session Replay.
10. Mixpanel has heatmaps
Heatmaps are a visualization layer built on top of Session Replay. Instead of watching sessions one by one, heatmaps aggregate thousands of sessions into a single visual map showing where users click, tap, scroll, or hesitate the most.
What makes Mixpanel's heatmaps different is that they're tied directly to your existing analytics events. You're not just seeing where people clicked. You can connect those clicks to outcomes like signups, purchases, or feature adoption. The animation here shows how heatmaps work together with session replay.
11. Mixpanel has an audit log
For teams requiring visibility into who is doing what across their organization, Mixpanel provides an audit log that tracks activity across projects and the org. Enjoy the ability and peace of mind as to who made changes, when they occurred, and what was modified. This is particularly useful for enterprise teams managing data governance, access control, and compliance requirements, giving admins a clear record of changes without having to dig through individual project settings.
Audit log is available on all Mixpanel customer plans. Free and Growth plans retain logs for 90 days. Enterprise plans retain logs for 2 years.
12. Saved Metrics and Behaviors keep every team working from the same definitions
Saved Metrics and Behaviors let you define key measurements and user actions once, then reuse them across every report and board in your project. Instead of each team member rebuilding "Monthly Active Users" or "Checkout Completion" from scratch, or slightly differently each time, you save the definition once, share it, and everyone works from the same logic. If a definition changes, you update it in one place and it propagates across all reports that use it.
In other words: you’re no longer second guessing metrics nor reinventing the wheel each time you open a new report. Saved Metrics and Behaviors are available to all customers; sharing requires a Growth or Enterprise plan. Learn more in our Docs.

Data quality and infrastructure
13. Mixpanel tracks the full user journey, including pre- and post-authentication behavior
Mixpanel tracks user behavior throughout the entire journey by maintaining events and user attributes in separate tables. Tracking code can be placed on any page or screen via Mixpanel's SDKs, and Mixpanel stitches pre-authentication events (before a user logs in) to post-authentication behavior (after).
Bottom line: You get a complete, continuous picture of how a user moved through your product, from first visit to conversion and beyond.
14. Funnel analysis runs 3-7x faster than a data warehouse
Mixpanel Funnels run 3 to 7x faster than the same queries in a data warehouse, thanks to Mixpanel's Arb data storage and query engine. For teams used to waiting on warehouse queries, that difference is noticeable: fast enough to answer follow-up questions in the same sitting rather than filing a ticket and coming back tomorrow.
Mixpanel also supports unlimited funnel steps, which matters more than it sounds. Most tools cap how many events you can string together. Mixpanel doesn't, so you can map a full user journey without splitting the analysis into pieces or stitching results together after the fact (see also #22 below).
15. Complementary to BI tools, not a replacement
BI tools and Mixpanel are built to answer different questions. Tableau, for example, analyzes data across your warehouse: sales, finance, operations, and whatever else lives in there.
Mixpanel answers product-usage questions, such as:
- What did users do?
- Where did they drop off?
- What drives retention?
Mixpanel is event-centric from the ground up, from the UI to the infrastructure. The platform works with BI tools not against, and Mixpanel's Warehouse Connectors make that pairing easier than ever.
16. Warehouse Connectors and Mirror keep Mixpanel in sync with your warehouse in real time
Mixpanel connects directly to your data warehouse (Snowflake, BigQuery, Databricks, Redshift, and Postgres) via Warehouse Connectors. Mirror mode takes it further: it automatically syncs any additions, updates, or deletions in your warehouse so Mixpanel always reflects your source of truth. No re-tagging, no stale data, no manual imports.
By unifying business data with product usage events, you can answer many more questions in Mixpanel, such as:
- What percentage of Enterprise revenue uses the features we shipped last year?
- Did our app redesign reduce support tickets?
- Which account demographics have the best retention?
Most teams answer these questions in spreadsheets, weeks after they should. Warehouse Connectors and Mirror help answer them in minutes in Mixpanel.
17. Data is retained for up to 2 years, longer than Google Analytics
Mixpanel retains your data for up to 2 years. Google Analytics 4 retains event-level data for as little as 2 months by default, with a maximum of 14 months. If you need to look back at cohort behavior, seasonal trends, or long-term retention curves, Mixpanel has the data. GA likely doesn't.
➡️ See the full Mixpanel vs. Google Analytics comparison.
Governance and enterprise readiness
18. Top-tier data governance built in
Mixpanel includes a full suite of data governance tools: Lexicon (a data dictionary for your events and properties), Data Views and Classification, Data Standards, Event Approval, Data Volume Monitoring, and Data Clean-Up. Teams can manage what data gets tracked, who can see it, and whether it meets quality standards, without relying on engineering for every change.
Learn more about Mixpanel data governance in our Docs.
19. Enterprise-grade by default: unlimited seats and saved reports
Mixpanel's Enterprise plan includes unlimited seats and unlimited saved reports, so scaling your team's access doesn't mean scaling your bill. Security and compliance certifications include SOC 2 Type II, GDPR, and CCPA, along with options for single sign-on, two-factor authentication, and data residency in the United States, European Union, and India.
Learn more about Mixpanel security and privacy.
20. Pricing scales on event volume, not seat count or query volume
Unlike many other analytics providers, Mixpanel pricing is based on the volume of events you send, not on how many people use it or how many queries get run. That means your entire team (product, marketing, engineering, data) can access without adding per-seat license costs. Everyone can explore data without someone watching the tab.
Analysis depth
21. View multiple metrics in the same chart in Mixpanel
Mixpanel lets you plot multiple metrics simultaneously (DAU, conversion rate, retention rate, total orders, average purchase value) in a single chart. No more opening multiple reports and eyeballing comparisons. You can see correlations and relationships directly, and break each metric down by any property or cohort.
22. Funnel analysis with statistical significance built in
Mixpanel's Funnel analysis goes deep: unlimited steps, breakdown criteria, and a "Find Interesting Segments" feature that automatically shows which cohorts are converting significantly better or worse than average. Statistical significance is also built into all funnel analysis when you apply a breakdown by property or cohort.
➡️ Learn more about Mixpanel Funnels.
23. Complex attribution models, including custom models
Mixpanel supports multiple attribution models out of the box: First Touch, Last Touch, Linear, Participation, Time-decay, U-shaped, J-shaped, and Inverse J-shaped. Custom models are also supported, giving you the freedom to customize the weight given to the first touchpoint, the last, and everything in between. However your funnel is structured, Mixpanel gives you the flexibility to attribute conversion credit the way your business actually works.
24. Account-level behavior analysis, not just individual users
For B2B teams, Mixpanel supports account-level analytics through Group Analytics. Track activation progress, analyze product adoption at the account level, connect account behavior to revenue, identify power users within strategic accounts, and flag churn risk, all without switching tools.
*Account Profiles and Activation Metrics are available for customers with the Group Analytics add-on.
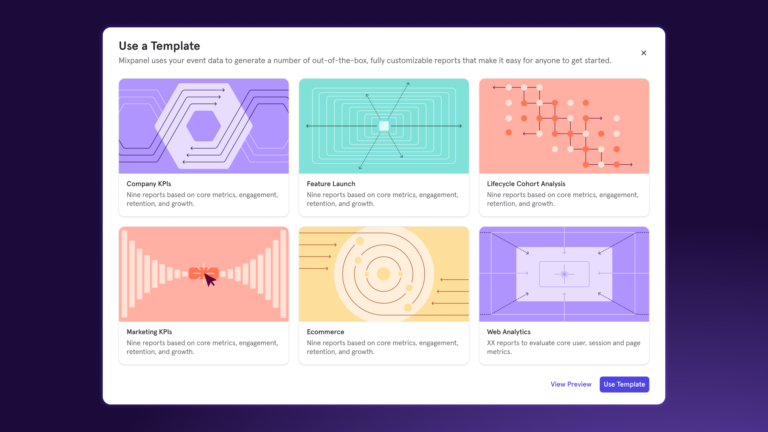
25. Mixpanel has advanced revenue metrics and dedicated templates
Mixpanel enables subscription and transaction-based businesses to overlay revenue data with product and marketing data. Customizable ecommerce and B2B SaaS templates are included, and you can restrict access to revenue data with Data Views to ensure only approved users see sensitive numbers. Read the interview with our PM here for more details.
➡️ Learn more about Mixpanel Revenue Analytics in our Docs.
Ease of use and support
26. No SQL required: self-serve analysis for every team
Mixpanel is built for self-serve analysis. Anyone on your team can explore trends, build funnels, and pull retention analysis without writing a line of SQL (see also MCP server in #7). The query builder uses four core report types (Insights, Funnels, Flows, and Retention) with consistent controls across all of them. Event context is included in the query builder so you always know you're analyzing the right data.
27. Autocapture for faster implementation
Getting started with Mixpanel doesn't require tagging every event manually. Autocapture is the best way to start using Mixpanel quickly. Once enabled via SDK, you can collect commonly tracked events (page views, form submissions, file downloads, attribution UTMs, clicks, and DOM interactions) with a single code snippet. You can modify defaults, define events you don't want tracked, and blacklist specific areas of your product.
Autocapture is available to all Mixpanel customers.
28. Mixpanel has a 97.2% CSAT across email, phone, and live chat support
Mixpanel's support team maintains a 97.2% customer satisfaction rating across email, phone, and live chat. Beyond support, Mixpanel offers onboarding packages, Mixpanel University for self-paced learning, migration packages from other analytics providers, and a network of certified implementation partners with industry-specific expertise.
➡️ See more customer validation in case studies.
Where to go from here
This list isn't everything, but it covers what's most often misrepresented. Mixpanel has more depth than any single article can capture: data governance, attribution, integrations, and AI capabilities we're continuing to build.
To see how Mixpanel applies to your use case or tech stack, get in touch with us.