


North Star maps vs. algebraic KPI trees: How to know what to choose

Here are two metric maps for Notion. Same company, same underlying data, both generated by AI… and they look nothing alike.
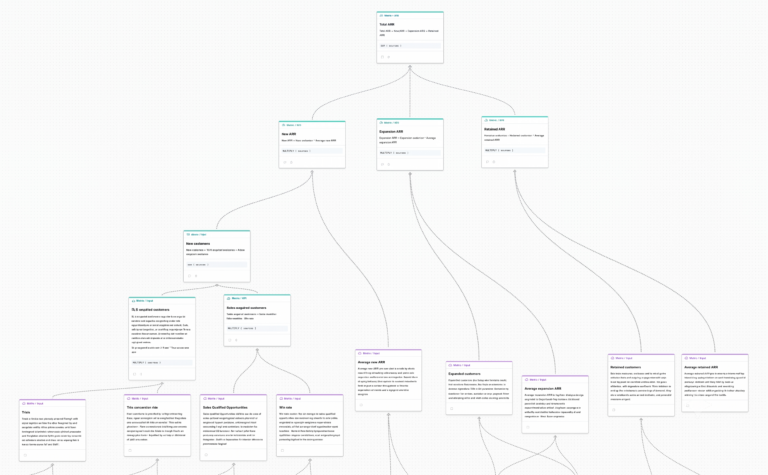
One decomposes revenue into a clean algebraic formula, which is great for high-confidence causal connections and estimating impact, but it can bias teams toward short-term revenue wins at the expense of long-term advantage.
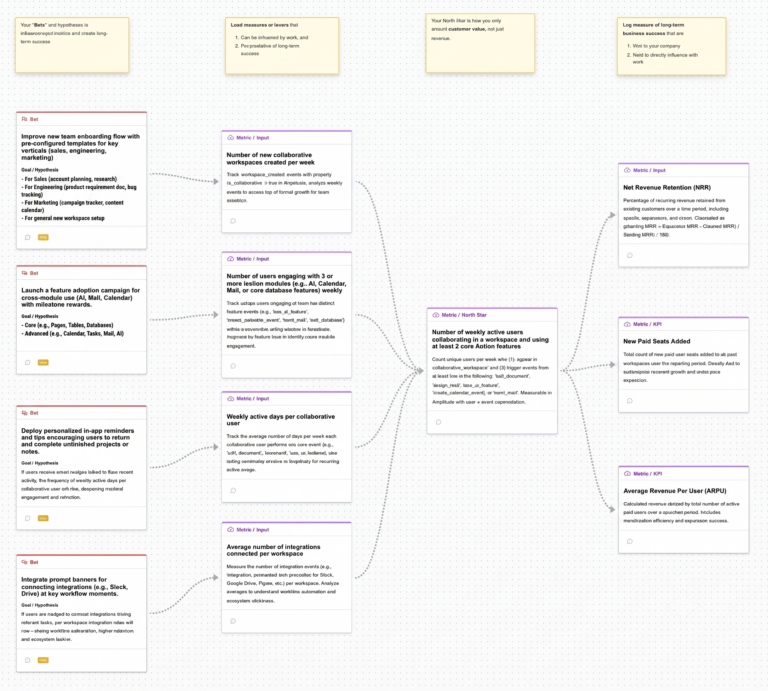
The other centers user value and traces the path to long-term loyalty, but it makes causality harder to prove and impact harder to tie directly to revenue.
Both maps are built from the same data and "correct." But the structure of the map you choose shapes how your team thinks—what it pays attention to and what it tends to miss.
Different companies use different languages. Some talk about input metrics. Others have growth models, KPI trees, or rely on North Star frameworks. The terminology varies, but the underlying idea is the same: the best companies have a clear model that connects everyday work to the business outcomes that matter.”
Below, we'll break down the two frameworks, the strengths and blind spots of each, and how to decide which one to reach for.
Algebraic KPI trees vs. North Star maps
Both algebraic KPI trees and North Star frameworks are metric maps. They help companies align behind shared goals, understand the impact of their initiatives, and focus on creating value instead of just shipping features. The difference is in how each one measures that value—and what it lets a team do with the result.
See how two ecommerce companies' frameworks compare in The Ecommerce PM's Metric Tree Playbook. Inside you'll see the four-level metric tree framework explained at each level, from strategic KPI to individual bet. Every metric and bet mapped to the specific number it's designed to move.
Algebraic KPI trees
An algebraic KPI tree (sometimes called a deterministic metric tree) is built on fixed mathematical relationships. You take a top-level metric and break it into its mathematical components.
Revenue, for example, could break down into number of visitors x conversion rate x average order value. From there, you keep going, decomposing each input into its own components until you reach the smallest metric you can act on. Each parent metric is the precise calculation of its children.
Since the relationships are mathematical, an algebraic KPI tree is accurate by definition, provided the inputs are right. Grow conversion rate, and revenue goes up; there's no question of whether the lever works. That makes these trees powerful for forecasting, root-cause analysis, and weighing trade-offs objectively.
The limitation is that they can be transactional. An algebraic tree tells you how to squeeze more out of what's already working, but not much about how to build long-term value for customers. Which is where the North Star map comes in.
North Star maps
A North Star map (also called a probabilistic or hypothesis metric tree) deals in hypotheses rather than certainties. The connections are based on evidence, not formulas: for example, the hypothesis that improving onboarding completion will increase week-one retention. It's measurable to a point, but no equation resolves the exact relationship between the two.
Netflix is the classic example. When it was still shipping DVDs to people's homes, it was trying to grow retention, a lagging indicator that's hard to move, because the levers that influence it aren't obvious and results take a while to show up. Netflix found that subscribers with three or more DVDs in their queue were far more likely to stick around. That signal became its North Star metric.
Three DVDs in a queue was a valuable indicator, but unlike a number in an algebraic tree, it isn't a mathematical certainty and can't be calculated cleanly. North Star maps built around signals like this help teams discover cause and effect inside their product, test assumptions, and evaluate new levers.
Strengths and weaknesses of each framework
Each framework has advantages and disadvantages, depending on company goals. Here's the breakdown:
North Star map vs. algebraic KPI tree
| North Star map | Algebraic KPI tree |
|---|---|
| ✅Centers long-term product value and user loyalty, keeping teams focused on why users come back—not just whether they convert. | ✅Causal connections are explicit and formulaic, making it easier to build high-confidence business cases and estimate the impact of a specific change. |
| ✅Anchors the team against short-term pressure by asking: does this actually make the product more valuable to users? | ✅Makes tradeoffs between specific levers explicit, so teams can calculate which inputs have the most room to move. |
| ❌The causal path from user behavior to revenue is indirect. It can be harder to prove causality or tie impact directly to revenue. | ❌Biases teams toward metrics with short, legible causal chains—which are often short-term revenue proxies—at the expense of longer-horizon user value. |
Choosing the right framework for your situation
Both algebraic KPI trees and North Star maps are valuable. The question isn't which framework is better, but rather, which structure serves the problem you’re trying to solve right now.
Using multiple models at once can be overwhelming for many teams, so making the right choice is important.
In theory, it makes sense to use both because they each serve different purposes. In practice, if you're trying to use it as a tool to align a company around, then having multiple types of models is just too overwhelming for most teams.”
When Algebraic KPI trees make more sense
Start by looking at the most important metric for your company. Is it a revenue metric? Can you break it down mathematically? If so, start with an algebraic KPI tree. Companies where customer value is tied closely to revenue, like ecommerce companies or finance companies, are most likely to see benefits from algebraic KPI trees.
If it feels like that metric doesn’t resonate with what you need to do to generate customer value, using an algebraic KPI tree might not make sense.
For example, users of subscription products can stop using a product months before they churn. If you optimize your product solely around paid subscribers, you might miss signs of customer dissatisfaction until it’s too late. That’s a good indicator to look at building a North Star map instead.
Growth teams focused on optimization work will benefit from Algebraic KPI trees.
In general, Algebraic KPI trees support fast fixes and quick gains. North Star maps are more conducive to long-term strategy planning.
When to build a North Star map
Product teams that want to understand who their users are and what makes them stick around will benefit from a North Star map. Companies where value is not tied as closely to revenue metrics will also benefit.
For example, media companies like Spotify measure value through the number of minutes played. The more use a customer gets, the more value they see from the product. But “number of minutes played” is not directly tied to revenue. Mathematically, it’s harder to quantify the relationship between the two numbers. North Star maps help drive long-term customer value.
Use AI to help build your metrics framework with AI Metric Trees.
No matter what framework you choose, operationalizing is the key
At the end of the day, the purpose of a metric map is to help teams decide what work to do.
Having a framework that ties all of your different initiatives and goals together helps you draw those connections and make those decisions. But for it to be useful, teams need to use it. A metrics framework that sits gathering dust in a digital drawer somewhere is no different than not having a framework at all.
No matter which option you choose, Mixpanel Metric Trees can help you build a framework for data-driven prioritization and structure for decision-making. You can build a North Star map, decompose its input metrics algebraically, and connect the two. In Mixpanel, every filter and user property can be sliced and diced through your Metric Tree, which gives you access to all of your behavioral data in one framework.
Build a metrics framework with Mixpanel Metric Trees today.