

What is an ecommerce dashboard? Metrics, types, and how to build one

Most ecommerce dashboards tell you what happened. Revenue dropped 12% last week. Cart abandonment is up. Conversion rate is down. What they don't tell you is why — and that's the part that actually determines what you do next.
That gap exists because ecommerce data is fragmented by design. Sales data lives in Shopify, traffic in Google Analytics 4 (GA4), advertising performance in Meta Ads Manager, and customer engagement metrics spread across email platforms, CRMs, and analytics software. Teams end up with a lot of numbers and not enough answers.
A well-built ecommerce dashboard changes that. Dashboards consolidate data into a single view and connect outcomes to the behaviors that drive them, so when something changes, you know where to look.
What is an ecommerce dashboard?
An ecommerce dashboard is a centralized view of the metrics and key performance indicators (KPIs) that matter most to an online store, consolidating data from multiple sources, including ecommerce platforms (like Shopify, WooCommerce, or BigCommerce), web analytics platforms, advertising channels, and customer behavior analytics platforms.
That means instead of constantly switching between all of these windows and tabs, teams can monitor performance from a single interface.
Why ecommerce teams need a dashboard
An ecommerce dashboard takes fragmented information and creates a shared source of truth across teams. That leads to a few benefits:
- Faster decision-making: By the time a weekly or monthly report arrives, the opportunity to act may have already passed. An ecommerce dashboard gives you near real-time visibility into performance so you can identify trends and make informed decisions faster.
- Better team alignment: A shared dashboard ensures every team is working with the same information instead of debating which reports or numbers are correct.
- More effective budget allocation: Dashboards let teams monitor metrics like customer acquisition cost (CAC) and revenue by channel in one place, which makes it easier to identify underperforming campaigns and minimize the risk of overspending.
- Improved customer experience: By highlighting drop-off points in the purchase funnel, checkout completion trends, and navigation patterns, dashboards help uncover issues that are preventing shoppers from converting.
Types of ecommerce dashboards
Let’s look at a few common types of ecommerce dashboards. Note that while each one highlights different aspects of performance, modern ecommerce analytics platforms bring all of this data together in a single source of truth. That way, teams can easily monitor specialized metrics while getting an overall view of how the business is doing.
Store performance dashboard
A store performance dashboard provides a high-level view of business health to stakeholders like ecommerce managers, leadership teams, and executives.
Example metrics:
- Total revenue
- Orders
- Average order value (AOV)
- Gross profit margin
- Revenue trends over time
Marketing KPI dashboard
Marketing dashboards focus on acquisition and campaign effectiveness, and help growth and marketing teams determine where to invest budget.
Example metrics:
- Return on ad spend (ROAS)
- Customer acquisition cost (CAC)
- Cost per click (CPC)
- Click-through rate (CTR)
- Revenue by channel
| Dashboard type | Audience | What it tracks | Key metrics |
|---|---|---|---|
| Store performance | Ecommerce managers, executives | Overall business health and top-line growth | Revenue · Orders · AOV · Gross margin · Revenue trends |
| Marketing KPI | Growth & marketing teams | Acquisition efficiency and campaign performance | ROAS · CAC · CPC · CTR · Revenue by channel |
| Web analytics | Product & growth teams | Visitor behavior and movement through the customer journey | Sessions · Traffic sources · Bounce rate · Conversion paths |
| Customer & retention | Growth, CRM & lifecycle teams | Long-term customer value and repeat behavior | CLV · Repeat purchase rate · Cohort retention · New vs. returning revenue |
Web analytics dashboard
A web analytics dashboard focuses on how visitors interact with the website and move through the customer journey there.
Example metrics:
- Sessions
- Traffic sources
- Bounce rate
- Conversion paths
- Landing page performance
Customer or retention dashboard
Acquiring customers is only part of the equation; for sustainable long-term growth, you need to retain them too. This dashboard helps teams identify which customer segments create the most long-term value.
Example metrics:
- Customer lifetime value (CLV)
- Repeat purchase rate
- Cohort performance
- Retention trends
- New versus returning customer revenue
What to track: Ecommerce dashboard metrics
While every business has unique needs, the majority of ecommerce metrics fall into five categories: sales and revenue, traffic and acquisition, customer behavior, customer value, and marketing performance.
Sales and revenue metrics
These metrics help teams understand whether the business is growing and where revenue comes from:
- Total revenue: How much money the business is bringing in; the top-line number that drives most decisions and that most stakeholders check first
- Average order value (AOV): How much customers spend per transaction; key to evaluating merchandising strategies, product bundles, and upsell programs
- Conversion rate: How effectively you’re turning visitors into customers; a declining conversion rate often signals friction in the customer experience or poor traffic quality
- Cart abandonment rate: Helps identify friction between purchase intent and completed transactions; if abandonment goes up, you may need to investigate shipping costs, checkout complexity, or technical issues
- Revenue by channel: Helps you understand where growth originates and which acquisition channels deserve additional budget
Traffic and acquisition metrics
Traffic metrics help teams evaluate the quality and quantity of visitors arriving at the store.
- Sessions: Your baseline measure of website activity; when revenue changes, session trends help determine whether the issue is traffic volume or conversion performance
- Traffic sources: Helps you decide which channels to invest in to drive awareness and conversion; typical sources include AI search, organic search, paid search, social media, email, and referral traffic
- Bounce rate: Tells you whether your landing pages are meeting visitor expectations; a high bounce rate is often the result of messaging mismatches, poor user experience, or low-quality traffic
- New versus returning visitors: Returning visitors typically convert at higher rates than first-time visitors, making this split a useful signal for both acquisition and retention strength
| Category | Key metrics | Decision it supports | Who uses it |
|---|---|---|---|
| Sales & revenue | Total revenue · AOV · Conversion rate · Cart abandonment · Revenue by channel | Is the business growing? Where does revenue come from? | Ecommerce managers, executives |
| Traffic & acquisition | Sessions · Traffic sources · Bounce rate · New vs. returning visitors | Which channels drive quality visitors? Where should we invest? | Growth marketers, performance teams |
| Customer behavior | Funnel drop-off · Checkout friction by step · Time to purchase · Navigation paths | Where are shoppers dropping off? What friction needs fixing? | Product managers, UX teams |
| Customer value | CAC · CLV · Repeat purchase rate · Refund rate | How sustainable is our revenue? Is acquisition spend justified? | Growth leads, finance teams |
| Marketing performance | ROAS · CPC · CTR · Email open & click rates | Which campaigns deserve more budget? What creative is working? | Marketing teams, paid media managers |
Customer behavior metrics
This is where many traditional ecommerce dashboards fall short, because they typically focus on outcomes such as revenue and ROAS.
A good ecommerce dashboard should also explain the why behind these outcomes. Some platforms have prebuilt dashboard templates that incorporate behavioral analytics, providing a structured way to track how shoppers move through the buying journey and where they encounter friction.
Here’s a sample template for an ecommerce analytics dashboard:
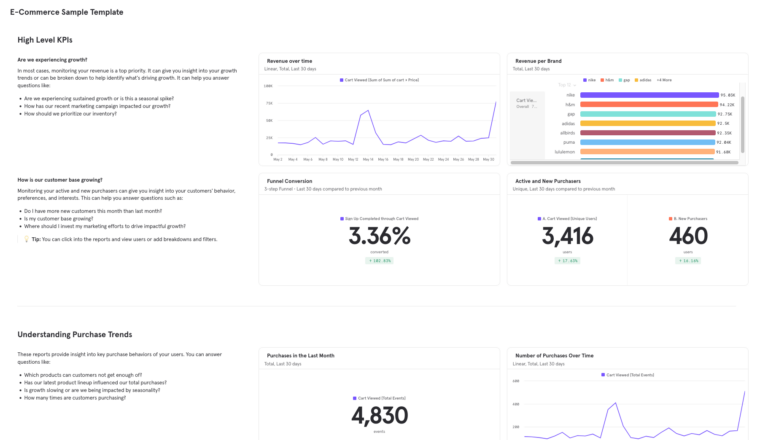
- Purchase funnel drop-off: Tracks how users move from product discovery to completed purchase, and helps you prioritize optimization efforts; for example, some users may drop off early on during the “add to cart” step, while others abandon their carts before checkout
- Checkout friction by step: tracking performance across individual checkout steps (like delivery selection, payment, and order review) can reveal specific sources of friction; this level of detail helps teams diagnose bottlenecks and prioritize fixes that have the greatest impact on revenue
- Time to purchase: Helps you understand buying behavior and optimize remarketing strategies for customers who require multiple visits before converting
- New versus repeat customer revenue: Gives you a more complete picture of acquisition quality; a channel that generates one-time buyers may appear successful in standard reporting, but contribute less long-term value than a channel that consistently drives repeat purchases
Customer value metrics
Customer value metrics help businesses evaluate how sustainable their revenue is.
- Customer acquisition cost (CAC): Measures the cost of acquiring a new customer, and is one of the pillar growth metrics alongside revenue and retention
- Customer lifetime value (CLV): Estimates the long-term revenue generated by a customer relationship, helping businesses make decisions about acquisition spending, retention investments, and overall growth strategy
- Repeat purchase rate: Indicates how often customers return to make another purchase, which makes this an especially important metric for subscription-based ecommerce businesses
- Refund rate: A high refund rate may indicate product quality issues, inaccurate product descriptions, fulfillment problems, or customer dissatisfaction
Marketing performance metrics
Marketing metrics connect acquisition activities to business outcomes.
- Return on ad spend (ROAS): Measures revenue generated relative to advertising spend, and helps teams evaluate campaign efficiency and prioritize budget allocation
- Cost per click (CPC): Helps marketers understand traffic acquisition costs across paid online channels and campaigns
- Click-through rate (CTR): Provides insight into ad relevance and creative performance; low CTR often signals messaging issues or poor audience targeting
- Email engagement metrics: Useful for optimizing subject lines, creative, audience segmentation, and send timing to improve campaign performance and customer engagement; key metrics include open rate, click rate, and conversion rate
How to build an ecommerce dashboard
You don’t need to display every available metric, but you should consider the needs of different stakeholder groups. Here’s how to start building an effective ecommerce analytics dashboard in four steps.
1. Define your audience
Start by identifying who will use the dashboard. For example, a growth marketer may need visibility into ROAS, CAC, and channel performance to allocate budget effectively, while an ecommerce manager may be more focused on revenue trends and conversion rates. Defining the audience upfront helps ensure the dashboard’s metrics support real business decisions rather than simply reporting data.
2. Identify your data sources
List the platforms where key ecommerce data lives. For many teams, that means pulling sales data from Shopify, traffic and conversion data from GA4, and campaign performance data from Meta Ads Manager. You may also want to include data from your email platform, CRM, or customer analytics platform. The goal is to bring these sources together into a consolidated and streamlined view.
3. Choose metrics that support decisions
Keep the dashboard focused. Every metric should answer a specific question. If a number doesn't influence a decision, it probably doesn't belong on the dashboard.
4. Set the right refresh cadence
Different metrics require different update frequencies. Sales performance and advertising spend may need real-time visibility, while CLV and retention metrics require a weekly or monthly check-in.
Start with a proven ecommerce dashboard template
A great ecommerce dashboard gives teams actionable visibility across revenue, acquisition, customer behavior, and retention.
If you're looking for a practical starting point, start with something like Mixpanel's free ecommerce dashboard template, which provides a ready-to-use framework for understanding not only what happened, but why. Use it to track purchase funnel drop-off, checkout completion trends, acquisition channel quality, repeat buyer behavior, and more.
Dashboards can help teams monitor key metrics and spot changes, but they can't answer every question.
Frameworks like metric trees connect high-level KPIs to the underlying drivers behind them, and session replay tooling can show you real user journeys. These help you go beyond reporting on buyer behavior to investigate the why behind it (and what to do next).
Explore Mixpanel’s dashboard templates gallery, or get started with Mixpanel for free.