

25+ ecommerce product metrics to track today

A lot of factors are putting pressure on ecommerce revenue, from consumer budget constraints to the rising costs of shipping and technology.
The impact shows up clearly in Mixpanel's 2026 Ecommerce Benchmarks, drawn from 423.1 billion events across 4.7 billion devices: North American ecommerce acquisition dropped 58% year-over-year, while global acquisition grew only 2%.
Ecommerce teams need a new metrics playbook that fits this new reality, and now they have it: Here are the metrics to track to drive ecommerce success.
Ecommerce product metrics: High-level KPIs
When the environment changes this fast, the first thing you need to know is whether your fundamentals are holding. This group of metrics gives you an overall sense of ecommerce business health, guides strategic decisions, and answers fundamental questions: Are we experiencing growth, and what’s driving it?
These top-level KPIs become focus metrics when you build a metric tree: They sit at the top of your tree, and their performance is impacted by other lower-level metrics, often called input metrics. That’s why it’s important to remember that high-level KPIs are valuable for a bird’s eye view, but they’re also lagging indicators of what’s already happened. Monitoring lower-level metrics closely helps understand what will happen and course-correct sooner.
Revenue over time
This is the overarching metric that shows you how your revenue is evolving. It allows you to compare different periods (year-to-date or Q1 of this year vs. Q1 of last year, for example) and spot trends, spikes, and patterns.
Revenue per brand (or per product)
Breaking down revenue by category shows which products and/or brands are most valuable. It helps to make comparisons, decide where to allocate resources or marketing spend, and get a more detailed picture of what is driving revenue and what isn’t.
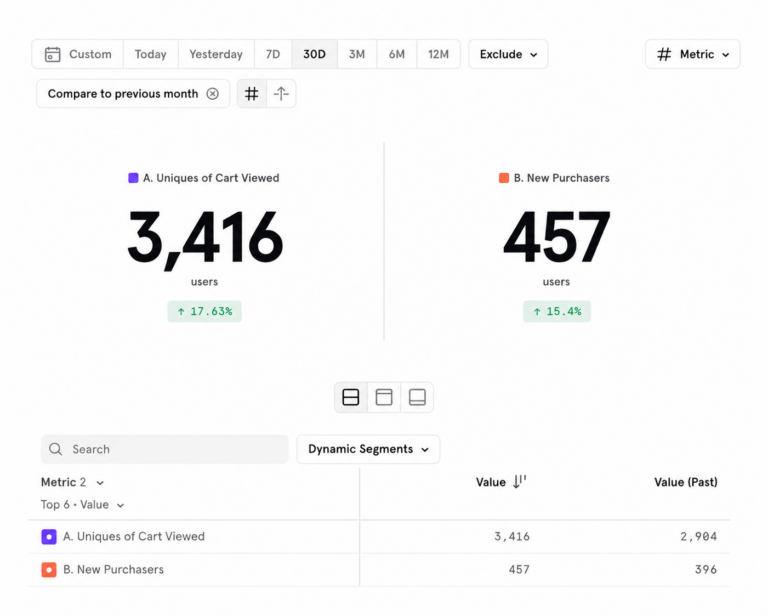
Active and new purchasers
Tracking the number of active and new purchasers over time gives insight into how a user base is growing and what percentage of purchasers are new vs. returning customers.
Seeing these numbers together helps answer questions such as:
- How many new customers have signed up this month compared to last month?
- Is my customer base growing or shrinking?
- Where should I invest my marketing efforts?
Average order value (AOV)
AOV is one of the top KPIs for ecommerce, calculated as total revenue divided by total number of orders. Understanding and increasing average order value helps ecommerce businesses increase revenue without spending more on customer acquisition.
Track AOV, LTV, CAC, and more: How to build revenue metrics in Mixpanel.
Customer lifetime value
LTV (sometimes also called CLV) tells you how valuable a customer is for your business over their entire relationship with you.
For ecommerce, LTV is usually calculated as: Average Order Value x Purchase Frequency x Customer Lifespan.
Breaking LTV down by cohort, time period, channel, or customer acquisition cost (CAC) helps determine how much to spend to acquire customers and where to invest that budget.
Revenue per visitor
Revenue per visitor is calculated by dividing total revenue by total visitors. It helps measure traffic quality and understand how effective your ecommerce business is at turning website traffic into revenue, which enables you to make better decisions about ad spend, targeting, and website optimization.
Ecommerce product metrics: Acquisition
The acquisition playbook that worked in 2021—spend broadly, grow fast, optimize later—is producing different results depending on where you operate.
Mixpanel’s 2026 ecommerce benchmarks found that acquisition trends are diverging by region: LATAM saw 117% year-over-year growth in new user acquisition, while North America experienced a 58% drop. In more mature markets, high CACs are pushing teams to move away from expensive acquisition channels to focus on long-term value and repeat purchases.
The aim is to understand where you're acquiring customers and what it really costs to keep them.
Top channels driving new users
Understanding where new purchasers come from helps lower CAC and adjust marketing efforts to have the greatest impact. Grouping channels by category (paid vs. organic, for example) gives more granular insights into customer acquisition.
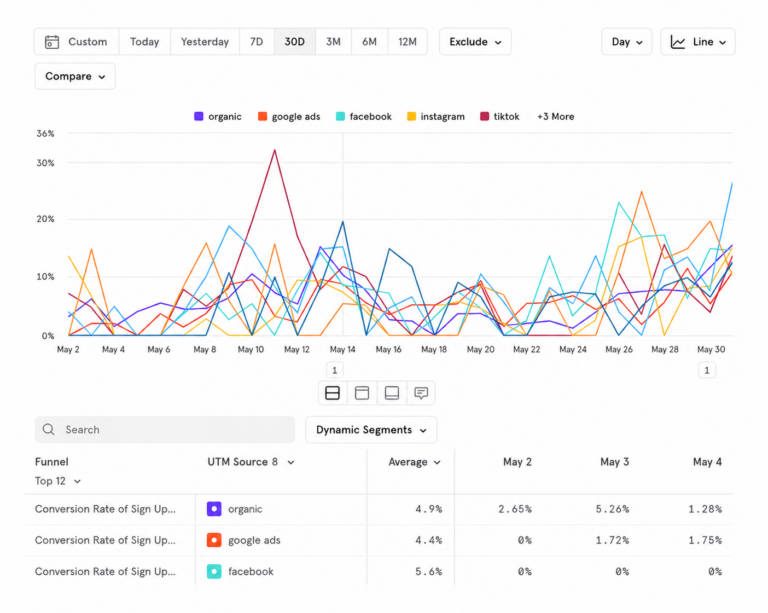
Channel conversion over time
This ecommerce metric breaks down conversions by source and charts how those conversions evolve over time. Monitoring these numbers helps understand how channels are gaining or losing effectiveness.
Customer acquisition cost (CAC)
CAC is one of the most important business metrics an ecommerce company can track. It’s calculated as: total marketing plus sales costs divided by number of new customers. If CAC consistently exceeds LTV, a business becomes unsustainable. Keeping close track of CAC (by cohort, by channel, etc.) gives a complete picture of revenue and customer value.
Return on ad spend (ROAS)
ROAS is a high-level efficiency metric that’s also one of the easiest metrics to measure: It’s simply revenue from ads divided by cost of ads. It helps ensure that ads are bringing in more than they cost to run.
See how your ecommerce metrics relate to each other using a metric tree.
Ecommerce product metrics: Conversion
“Add to cart” is a commonly used ecommerce conversion metric, but different metrics (like “purchase completed” can also be used, depending on how your funnel is structured. When acquisition keeps climbing, every visit counts more: a visitor who doesn't convert is wasted CAC. Conversion metrics help uncover friction points and understand what leads customers to purchase, and what might be preventing them.
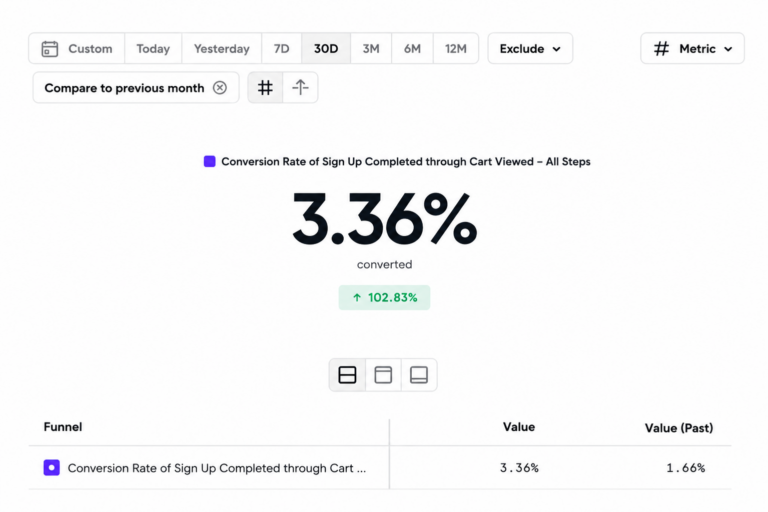
Funnel conversion
This metric gives you the percentage of users who completed a funnel, from sign up (or whatever activation metric you choose) all the way to conversion. It’s expressed as a percentage of users.
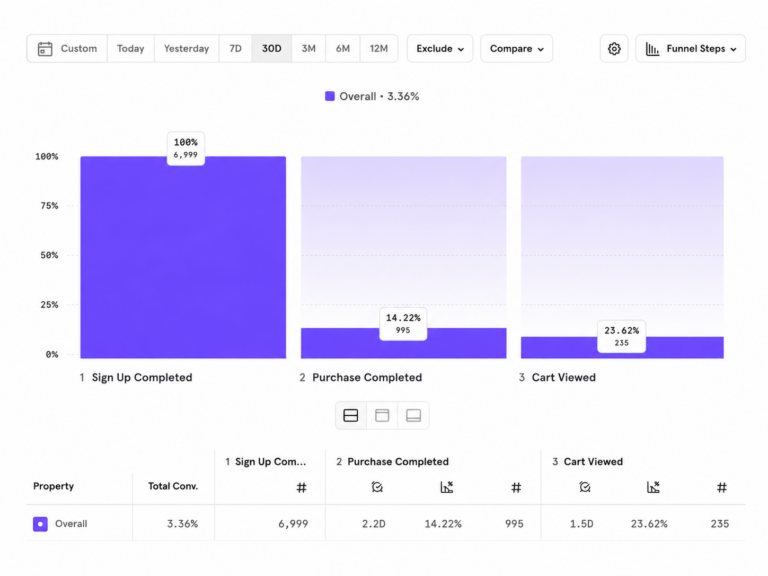
Purchase funnel
Mapping the steps that lead to customers purchasing is vital for ecommerce companies that want to understand and improve their sales process. It helps understand things like:
- How long until a customer makes their first purchase after viewing a product?
- What steps does a customer take before making a purchase?
Purchase funnel conversion over time
Tracking changes to purchase funnel conversions as they evolve helps understand trends, spot issues as they’re developing, and seize opportunities.
Add-to-cart rate
This metric shows you what percentage of visitors add at least one item to their cart. It’s a valuable measure of intent and product page effectiveness.
Top brand (or product) added to cart
Breaking down what users add to their cart by brand and product gives visibility into the most popular items in your store and helps you understand what’s driving conversions.
Cart abandonment rate
High cart abandonment rates indicate friction in the purchase process. Anything from high shipping costs to account creation requirements to simple browsing behavior (“just browsing”) can cause potential buyers to abandon their cart. Optimizing checkout processes, offering promo codes or flash sales, and sending abandoned cart emails help reduce cart abandonment.
Conversion by cart size
Analyzing conversions by cart size helps identify higher-value shoppers, understand the behaviors (or channels) that are more likely to precede larger purchases, and optimize marketing and checkout processes.
Ecommerce product metrics: Purchase trends
In a market where consumer budgets are constrained and product preferences are moving faster, purchase trend data becomes a leading indicator.
Knowing which products are driving volume, how long it takes customers to decide, and how purchase frequency is evolving gives you the necessary information to adapt inventory, marketing, and pricing early.
Purchases in the last month
Tracking recent purchases gives insights into incoming revenue and how purchases and revenue are trending over time.
User purchase flow
Analyzing user purchase flow gives you a complete view of what events precede purchases, like product viewed and checkout started. It’s a critical metric for optimizing user experience and maximizing revenue.
Number of Purchases over time
By tracking the number of purchases made over time, ecommerce businesses can better understand seasonal trends and analyze what causes spikes (and dips), like Black Friday or Memorial Day in the United States, Singles’ Day in China, or Diwali in India.
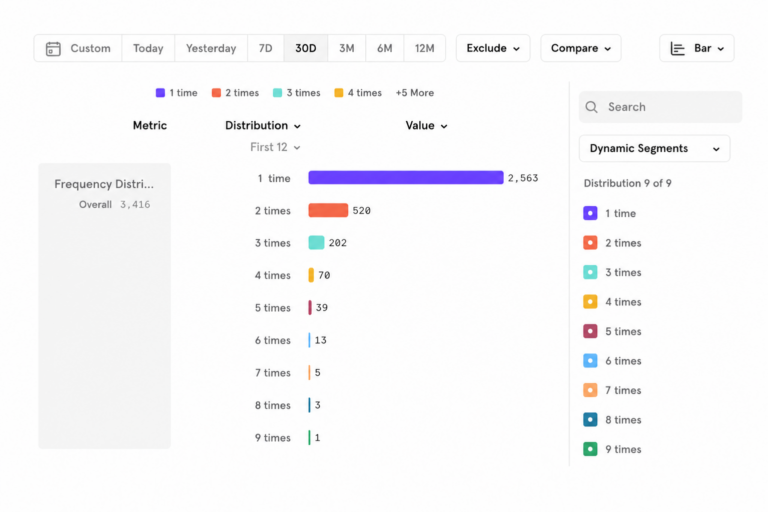
Number of times users purchased
This metric helps you see how many purchases users make in a defined period of time. Acquiring new customers can fluctuate, and finding ways to encourage repeat, consistent purchases increases customer lifetime value.
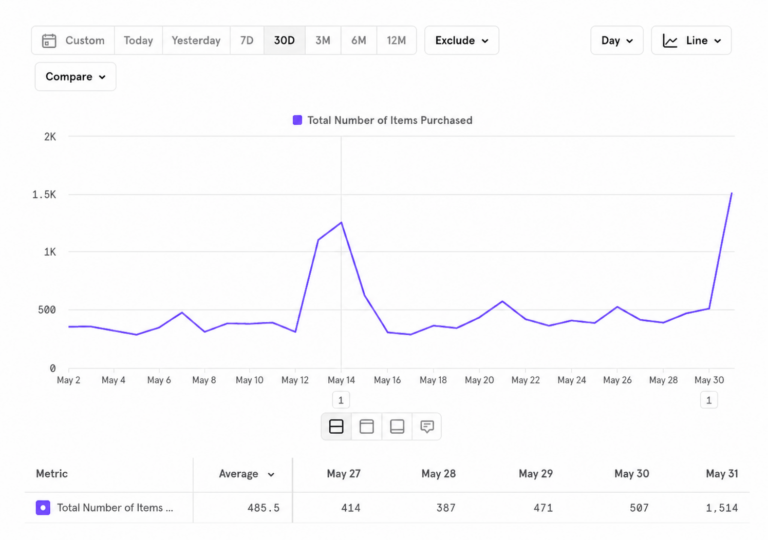
Number of items purchased over time
In addition to tracking how many purchases users complete, it’s valuable to know how many total items are being purchased to understand revenue, ROI, and seasonality trends.
Top purchased brand (or product)
Understanding which brands and products are most purchased gives insight into what really drives revenue.
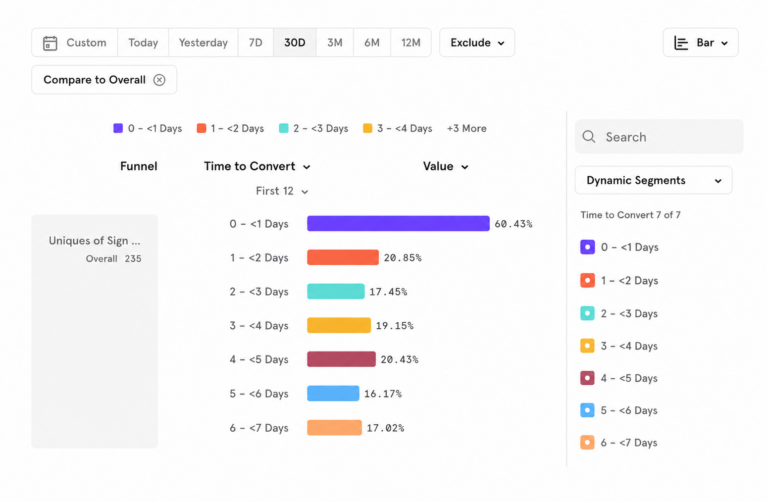
Time to purchase distribution
This metric measures how long it takes a visitor to convert into a customer. It helps ecommerce businesses learn more about the number of interactions needed for a purchase to occur.
Ecommerce product metrics: Retention and loyalty
Retention metrics are vital to understanding which ecommerce strategies are succeeding or failing, especially with ever-rising acquisition costs. According to the 2026 Ecommerce Benchmarks, one-week retention in North America has collapsed 98% YoY, signaling a misalignment between acquisition targeting and users finding immediate value.
Because of this, the second purchase matters more than the first, and measuring those return customers is increasingly a leading indicator of business health. Providing a positive post-purchase experience, subscription bundles, and loyalty programs can all help drive customers to return.
Purchase retention
Return customers are key for ecommerce success. Acquiring a new customer will always be more expensive than nurturing an existing one. According to McKinsey, “To make up for the loss of one existing customer, companies have to acquire three new customers.” Building those long-term relationships to keep acquisition costs down is crucial.
Repeat customer rate
This measures the percentage of customers who make more than one purchase (usually within a specific timeframe, like 30 or 90 days). It helps ecommerce businesses understand how many of their customers are new versus repeat. Repeat customer rates vary by industry, with higher-ticket items like electronics having lower rates than more frequently bought items, like clothing.
Churn rate
Measuring churn helps businesses track profitability. Measuring churn for ecommerce is trickier than for subscription-based companies, since it can be harder to determine when a customer has churned. Ecommerce companies start by looking at their average repeat customer timeline to build an estimate of when non-repeat customers can be considered churned (e.g., three or six months after purchase).
Companies struggling with high churn rates often need to re-examine their customer experience, communication, and competitiveness in the marketplace.
Refund and return rate
This metric measures the percentage of items returned by customers. Ecommerce refund and return rates tend to be higher than brick-and-mortar stores (24.5% vs. 8.72%, according to CapitalOne), and costs related to returns (shipping, processing, offering free returns) can significantly erode profit margins.
Getting started with ecommerce product metrics
Mixpanel’s ecommerce analytics suite includes cart analytics, funnel reports, retention analysis, and revenue analytics to make all of these metrics accessible and analyzable without SQL or engineering dependency.
Explore our ecommerce template or contact us to learn more about using Mixpanel for your ecommerce store.