


The hidden costs of your current analytics setup
Your analytics stack probably doesn't appear as a major cost on your budget. That might make it easy to think it isn't expensive.
But many product, growth, and data leaders already pay for their analytics setup every day; they’re just not paying through software invoices alone. They pay through delayed decisions, duplicated work, inconsistent data, and a growing dependence on analysts to answer routine questions.
Those costs rarely show up in a quarterly finance review. But you do notice them in the form of stalled product launches, endless Slack threads, conflicting dashboards, and teams that move more slowly because they no longer trust the numbers in front of them.
As organizations grow, these hidden costs compound. What might feel manageable when a company has a handful of teams becomes increasingly hard to sustain when hundreds of people rely on data to make decisions.
The December 2025 Forrester Total Economic Impact™ (TEI) study, a commissioned study conducted by independent global research firm Forrester Consulting on behalf of Mixpanel, puts measurable numbers to these familiar frustrations. While the findings represent a composite organization based on customer interviews, they offer a useful framework for understanding what fragmented analytics actually costs.
Review the total benefits, total costs, and three unquantified benefits of using Mixpanel for digital analytics in the complete study.
The biggest analytics costs never appear on a budget
Most organizations don't set aside a budget for slow decisions, nor do they approve spending for duplicate event tracking or conflicting dashboards.
But those costs exist.
Every time a product manager waits several days to understand a funnel drop-off or a marketing team delays campaign optimization because data hasn't arrived yet, the organization spends time and money.
Because those expenses span multiple teams, they rarely receive the same scrutiny as software licenses or infrastructure costs. Instead, they become accepted as "just how analytics works."
That assumption creates analytics technical debt, with teams continuing to add dashboards, reports, and workarounds without addressing the underlying structural issues.
When analytics becomes the “Wild West”
Most scaling companies don't design fragmented analytics systems. They simply grow into them.
Different teams implement tracking independently, naming conventions evolve without governance, and similar events somehow end up with very different labels. Those things happen every day.
One fintech data warehouse engineer interviewed for the Forrester study described the environment this way:
It was the Wild West, where PMs and marketing teams were responsible for their own data... You had duplicate or even triplicate events that were doing the same exact thing. There was no normalization.”
That quote captures a problem with duplicate events that many organizations are familiar with, and questions they’re probably already asking their analysts every week: Which signup event should a team trust? Which dashboard reflects reality? Why do marketing and product report different conversion rates for the same funnel?
The same Forrester interviewee also described a familiar escalation chain:
If a PM couldn't find what they needed, their immediate response was to ping an analyst, and then the analyst would ping the data team.”
It doesn't take long for this workflow to become a bottleneck. A product manager needs to understand this week's onboarding funnel, so they ask an analyst, who needs engineering to verify the event data. By the time the request makes its way through the queue, days or even weeks may have passed.
One Chief Product Officer at an online gaming company interviewed in the study described relying on sampled data that was delayed by eight to 10 hours, while the Principal Product Manager at a food service company reported that product managers would spend eight hours per week trying to get data.
Those delays illustrate how quickly analytics friction compounds, and why removing those bottlenecks can have such a measurable business impact.
How eliminating analytics bottlenecks pays off
Without shared standards and self-serve access, analytics teams often end up acting as the organization's help desk for data. Every conversion rate check, funnel analysis, or dashboard request lands in their queue, regardless of how routine it is. Many organizations respond by hiring more analysts or expanding their data function, but that just increases capacity incrementally without changing the core issues with this process.
But there are more effective approaches; organizations don't have to accept this workflow as the cost of doing business. The Forrester TEI study measures what teams recovered when they removed these bottlenecks. For example, after using self-serve analytics to reduce routine reporting work, interviewees reported saving approximately:
- five hours per week for analysts
- three hours per week for BI and data operations teams
- four hours per week for product managers
- three hours per week for marketers
Developer investigation time also fell from weeks to minutes for some workflows.
The impact extended beyond reporting efficiency. One interviewee, a Principal Product Manager in the food service industry, described how this changed marketing workflows:
Marketing teams now create micro cohorts and run targeted campaigns in minutes instead of days, saving 3 to 4 hours per request across multiple teams.”
For the composite organization in the study, those efficiency gains contributed to broader business outcomes.
The Forrester TEI study puts a dollar figure on what those bottlenecks cost, and what removing them is worth for the composite organization:
- $6.3 million in total risk-adjusted benefits
- $4.9 million net present value
- 354% return on investment
- Payback period of less than six months
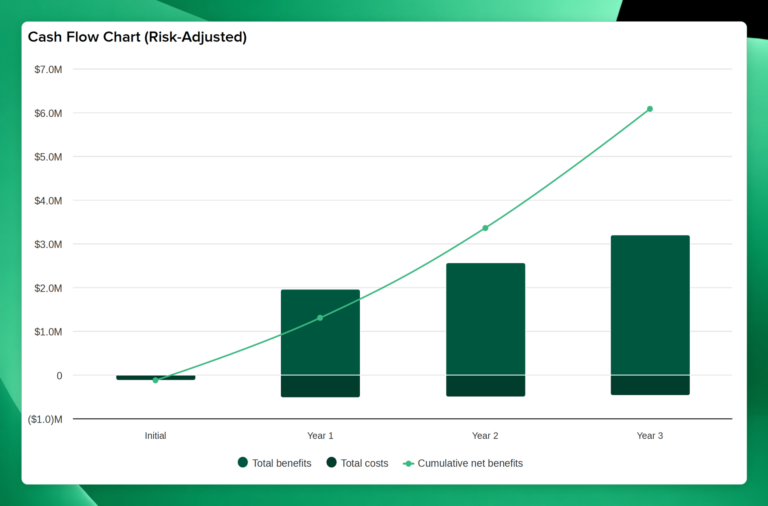
While these figures reflect outcomes for the composite organization created for the study and don’t represent results that every company will achieve, they illustrate how operational inefficiencies can add up to measurable business impact.
The solution is structural, not organizational
To solve the root cause of the problem, organizations need to rethink how teams access and manage data so more people can answer routine questions on their own.
That starts with self-serve analytics. Instead of relying on SQL or submitting requests for every new report, product, growth, and marketing teams should be able to explore user behavior, build reports, and answer questions themselves. An event-based data model makes that possible by letting teams extend analyses with new context and dimensions without involving the data team every time a new question comes up.
But a self-serve model only works when people trust the underlying data. Clear governance, shared event naming, and standardized definitions ensure everyone interprets metrics the same way instead of debating which dashboard or event to trust.
For example, data governance capabilities such as Mixpanel Lexicon provide a shared dictionary for events and properties, making analytics easier to understand and maintain as organizations scale. Rather than relying on tribal knowledge, teams work from standardized definitions that improve discoverability and consistency.
Beyond just making reporting faster, this removes a lot of work organizations were already paying for like delayed decisions, duplicate analyses, and manual reporting. When every team can access trusted product data on its own, analysts spend less time answering repetitive questions and more time solving strategic problems.
Once you recognize where those costs come from, it becomes much harder to treat analytics friction as just another part of doing business.
See what a fragmented analytics setup actually costs, and what teams recover when they fix it. Read the 2025 Forrester Total Economic Impact™ study. Or, if you'd like to explore what a self-serve analytics platform looks like in practice, learn more about Mixpanel's approach to product analytics.
